
Skip to content
New in 1.9.0The in-app guide is the website's help, one set of articles

Native NetSuite reporting.

HiScale Advanced Reports is a SuiteCloud app installed in your account. It turns SuiteQL into cached, filterable reports, drill-through summaries, dashboards and home-page portlets. NetSuite's own roles decide who sees them, and nothing runs on an external server.
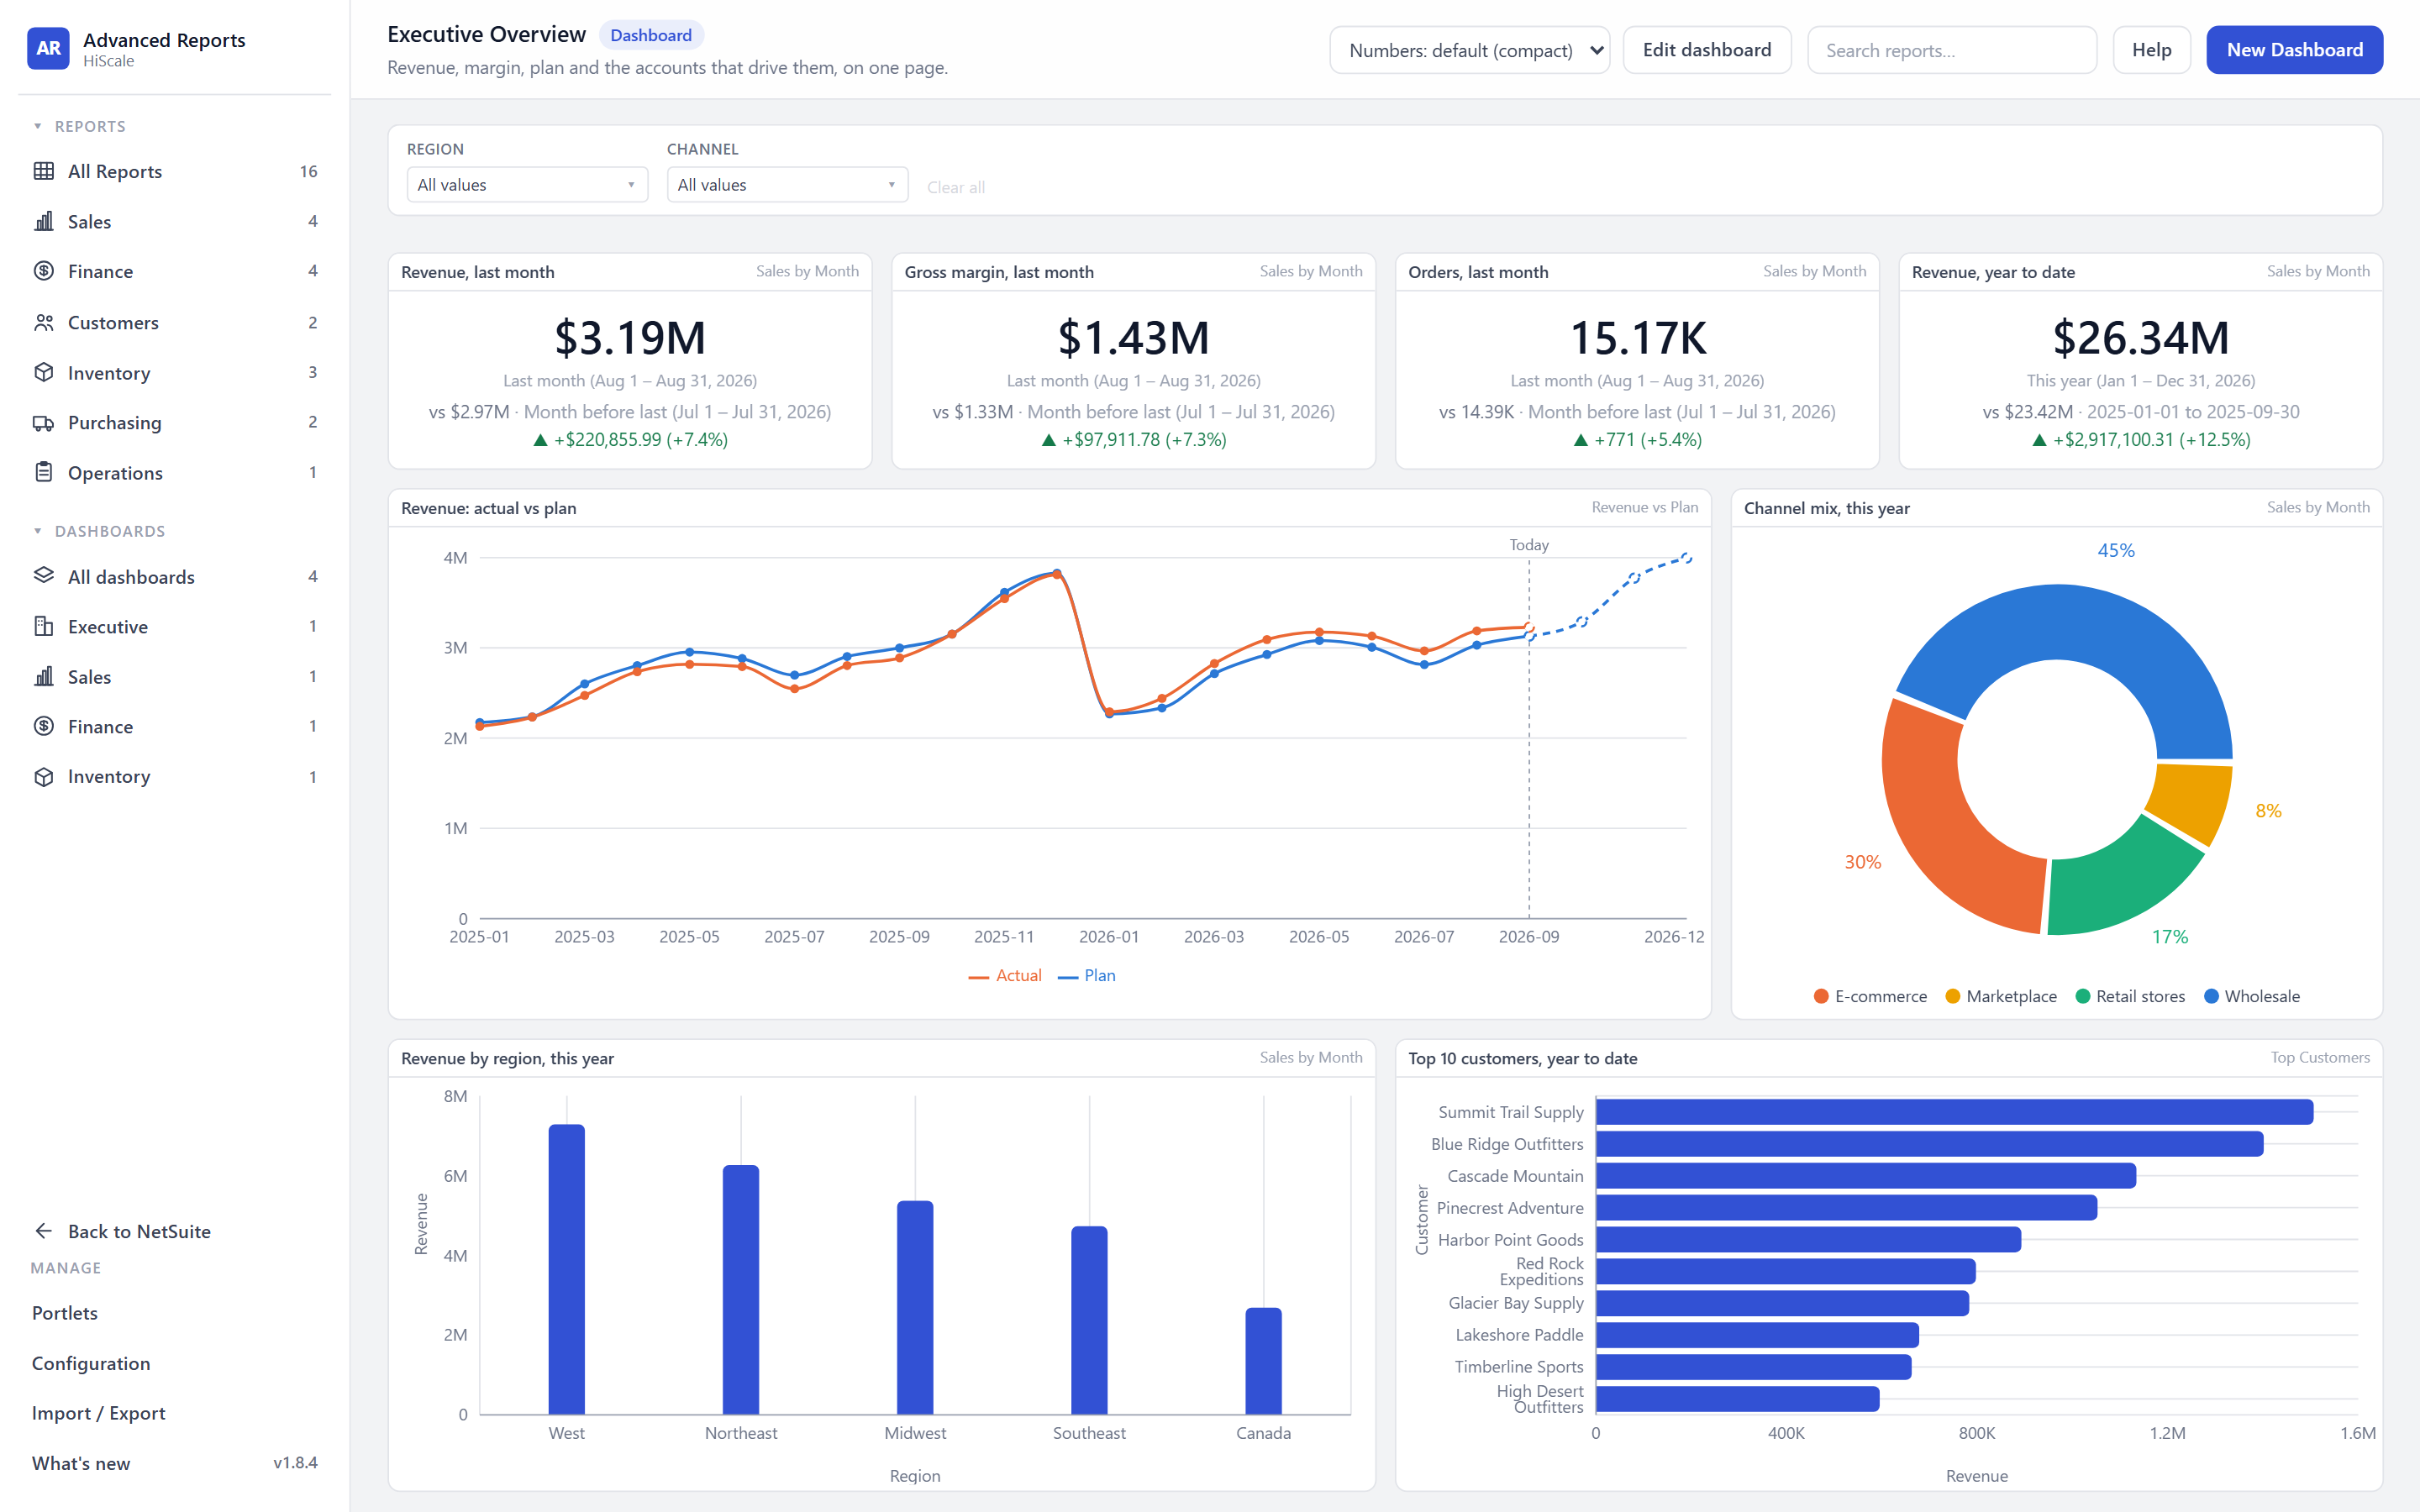
Executive Overview dashboard with Region and Channel filters, four stat tiles comparing last month and year to date with prior periods, a line chart of actual revenue against plan with the months after today dashed, a channel mix pie, a revenue by region bar chart and a top ten customers bar chart.
Current release
1.9.1Sep 24, 2026
Releases shipped
52since Aug 20, 2026
Runs on
SuiteCloudSuitelet, Map/Reduce, File Cabinet
Accounts
Any editionOneWorld or not
Why use it

For the reports a saved search cannot give you.

Opens from a cache, any size.

Reports refresh on a schedule in a Map/Reduce and open from a cached result. There is no row limit: a large result is stored in parts and read part by part, and a partial refresh fetches only the rows that changed.

  • Scheduled refresh
  • Partial refresh
  • No row limit

Written in SuiteQL, finished in a wizard.

Whoever can write the query can publish the report: columns with formats, filters viewers can change, drill-through links and a layout of charts and tiles. No SuiteScript and no deployment per report.

  • SuiteQL
  • Five-step wizard
  • Layout editor

Native to NetSuite, with NetSuite access rules.

A SuiteCloud app, not a connector. Every report and dashboard has an audience of NetSuite roles, subsidiaries, departments or employees. The server enforces it, portlets follow it, and a link to a report the viewer cannot open is never drawn.

  • SuiteCloud app
  • NetSuite roles
  • Archive and restore
What you can build

One query. Three places to read it.

A report is a stored SuiteQL statement with a layout. The same result feeds its own page, any number of dashboards, and a portlet on a NetSuite home dashboard.

01Reports

A table you can work in.

Columns with formats, filters viewers can change, a totals row and CSV or Excel export, over a result that opens straight from the cache.
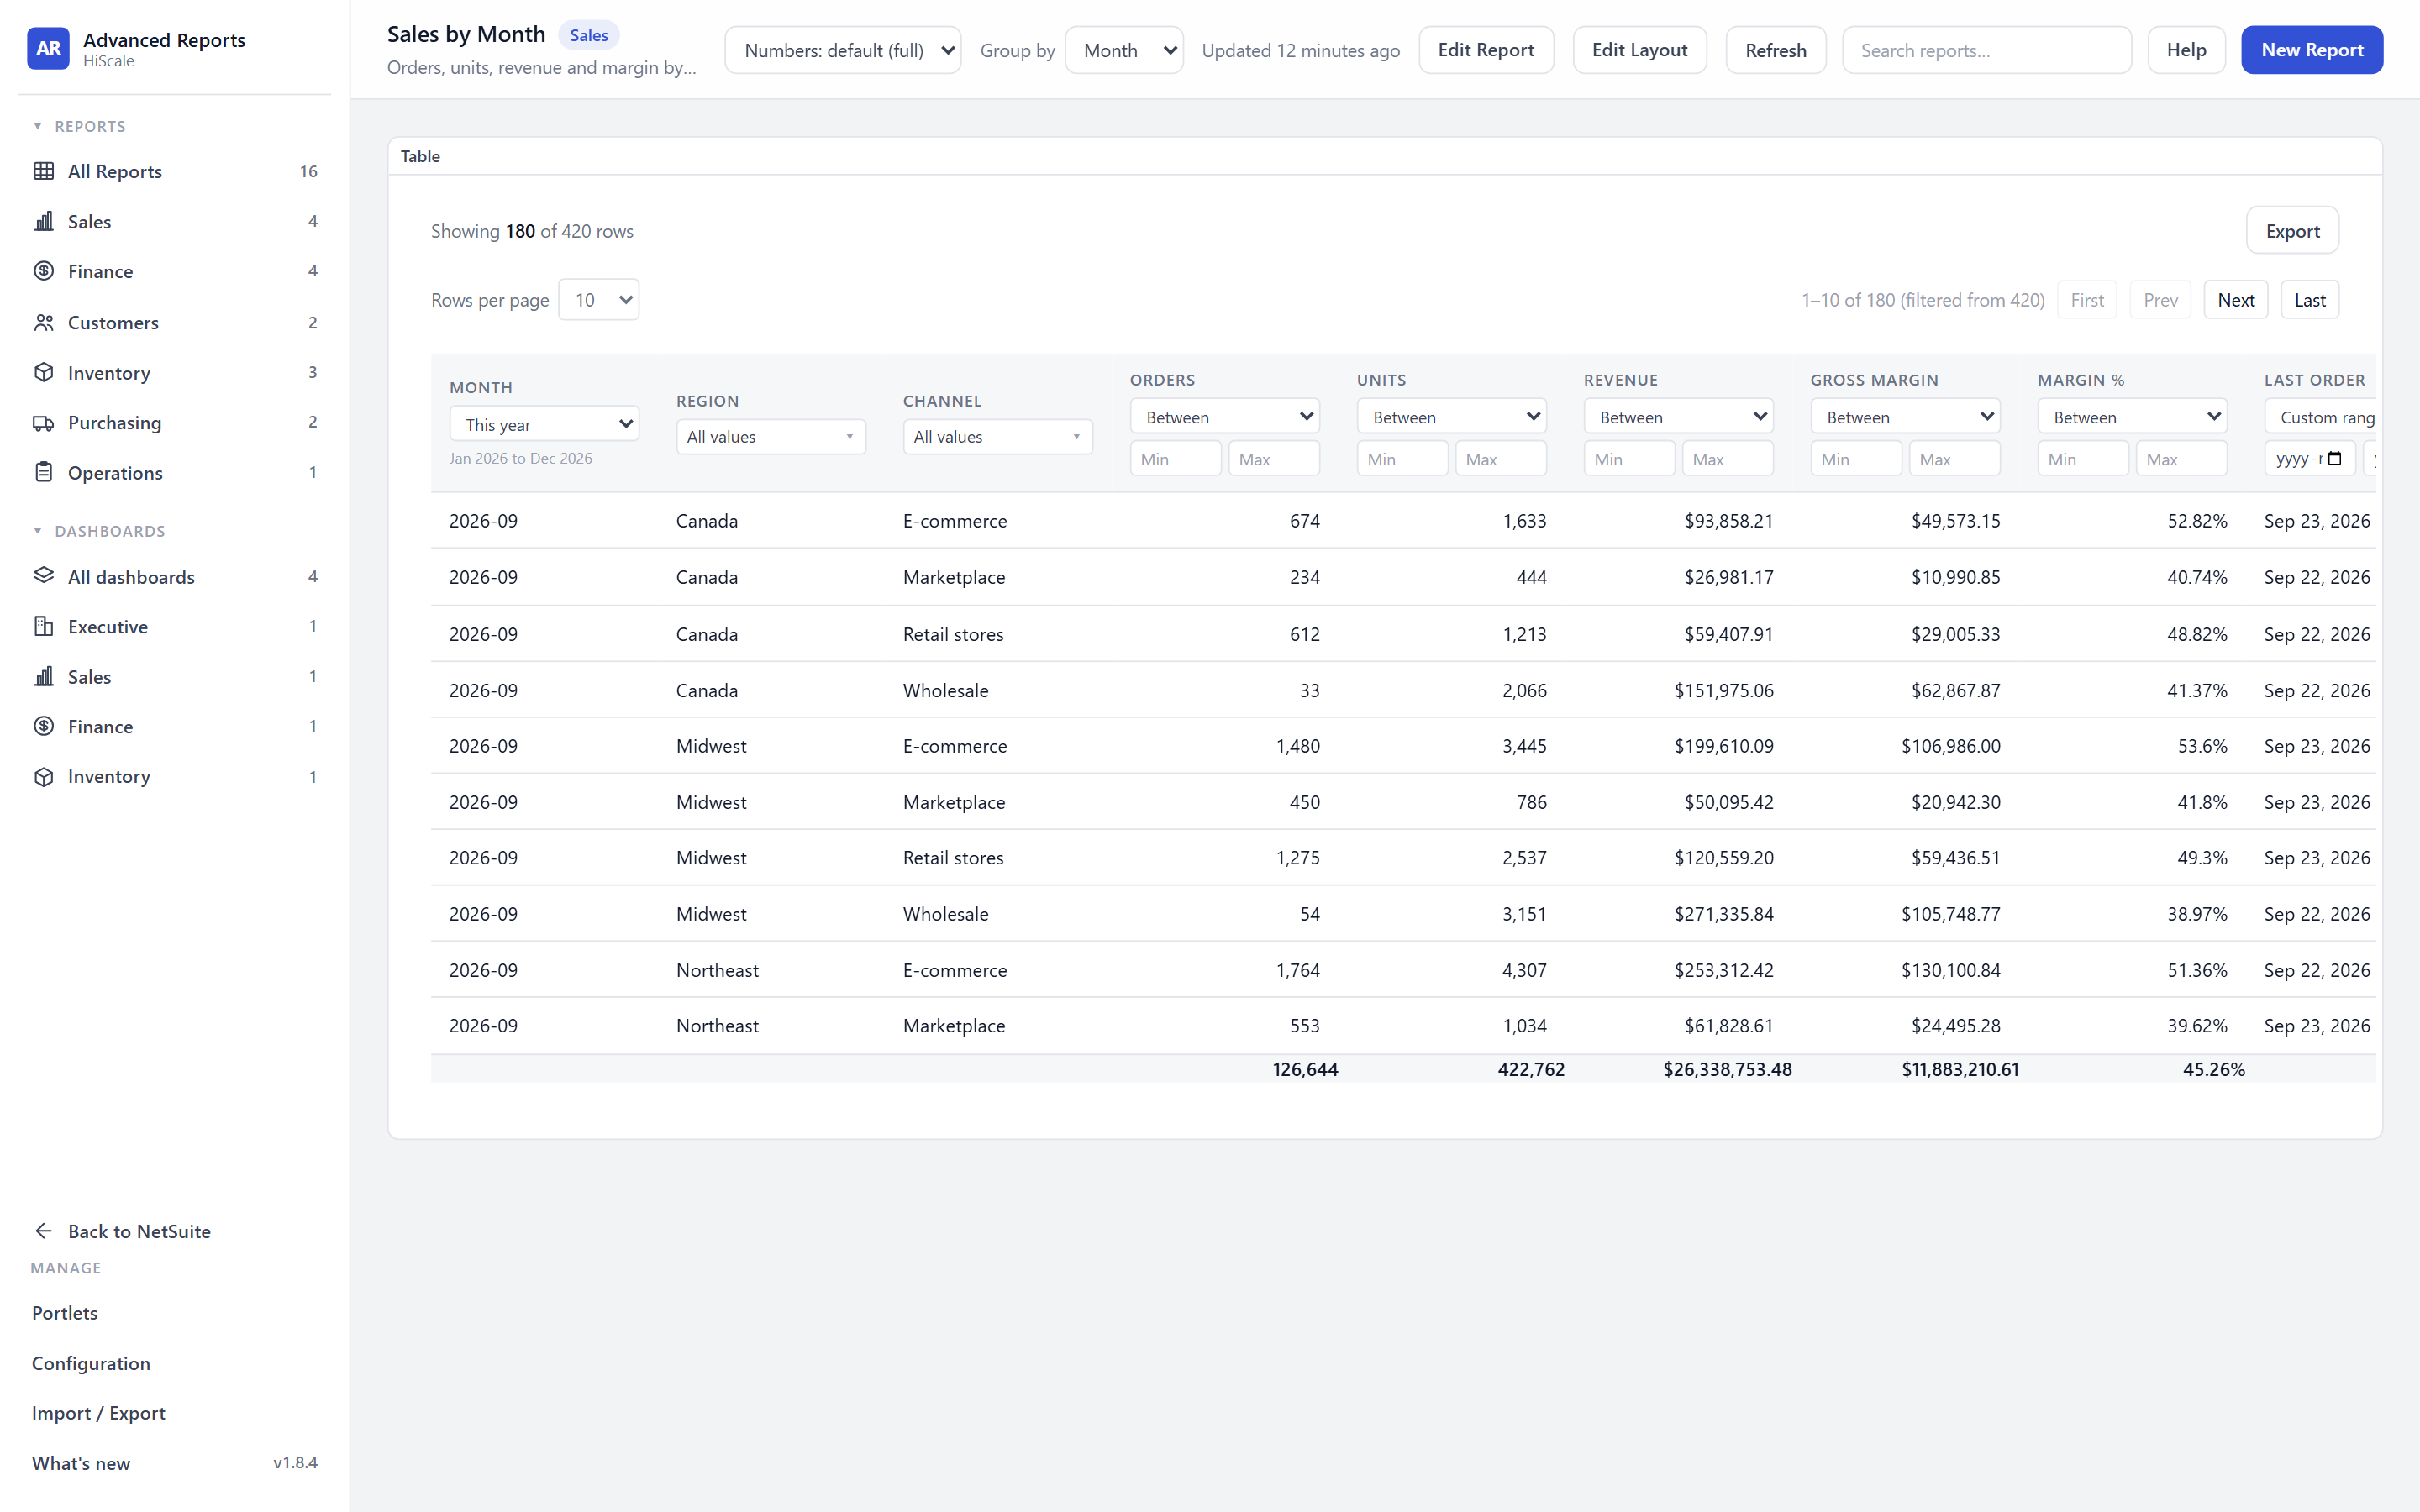
  • Filters by column type, with a short text syntax for OR, AND and exclusions
  • Group by month, quarter or year on one report, each measure rolled up by its rule
  • Drill-through from a summary figure to the rows behind it, and on to the record
More on reports
Sales by Month report showing a table of month, region, channel, orders, units, revenue, gross margin, margin percent and last order date, with a This year month filter, column filters, a totals row and a Group by Month control in the top bar.
02Dashboards

Several reports, one page, one set of filters.

Stat tiles, bar, pie, line and comparison charts, tables and income-statement layouts, each over any report the viewer can open.
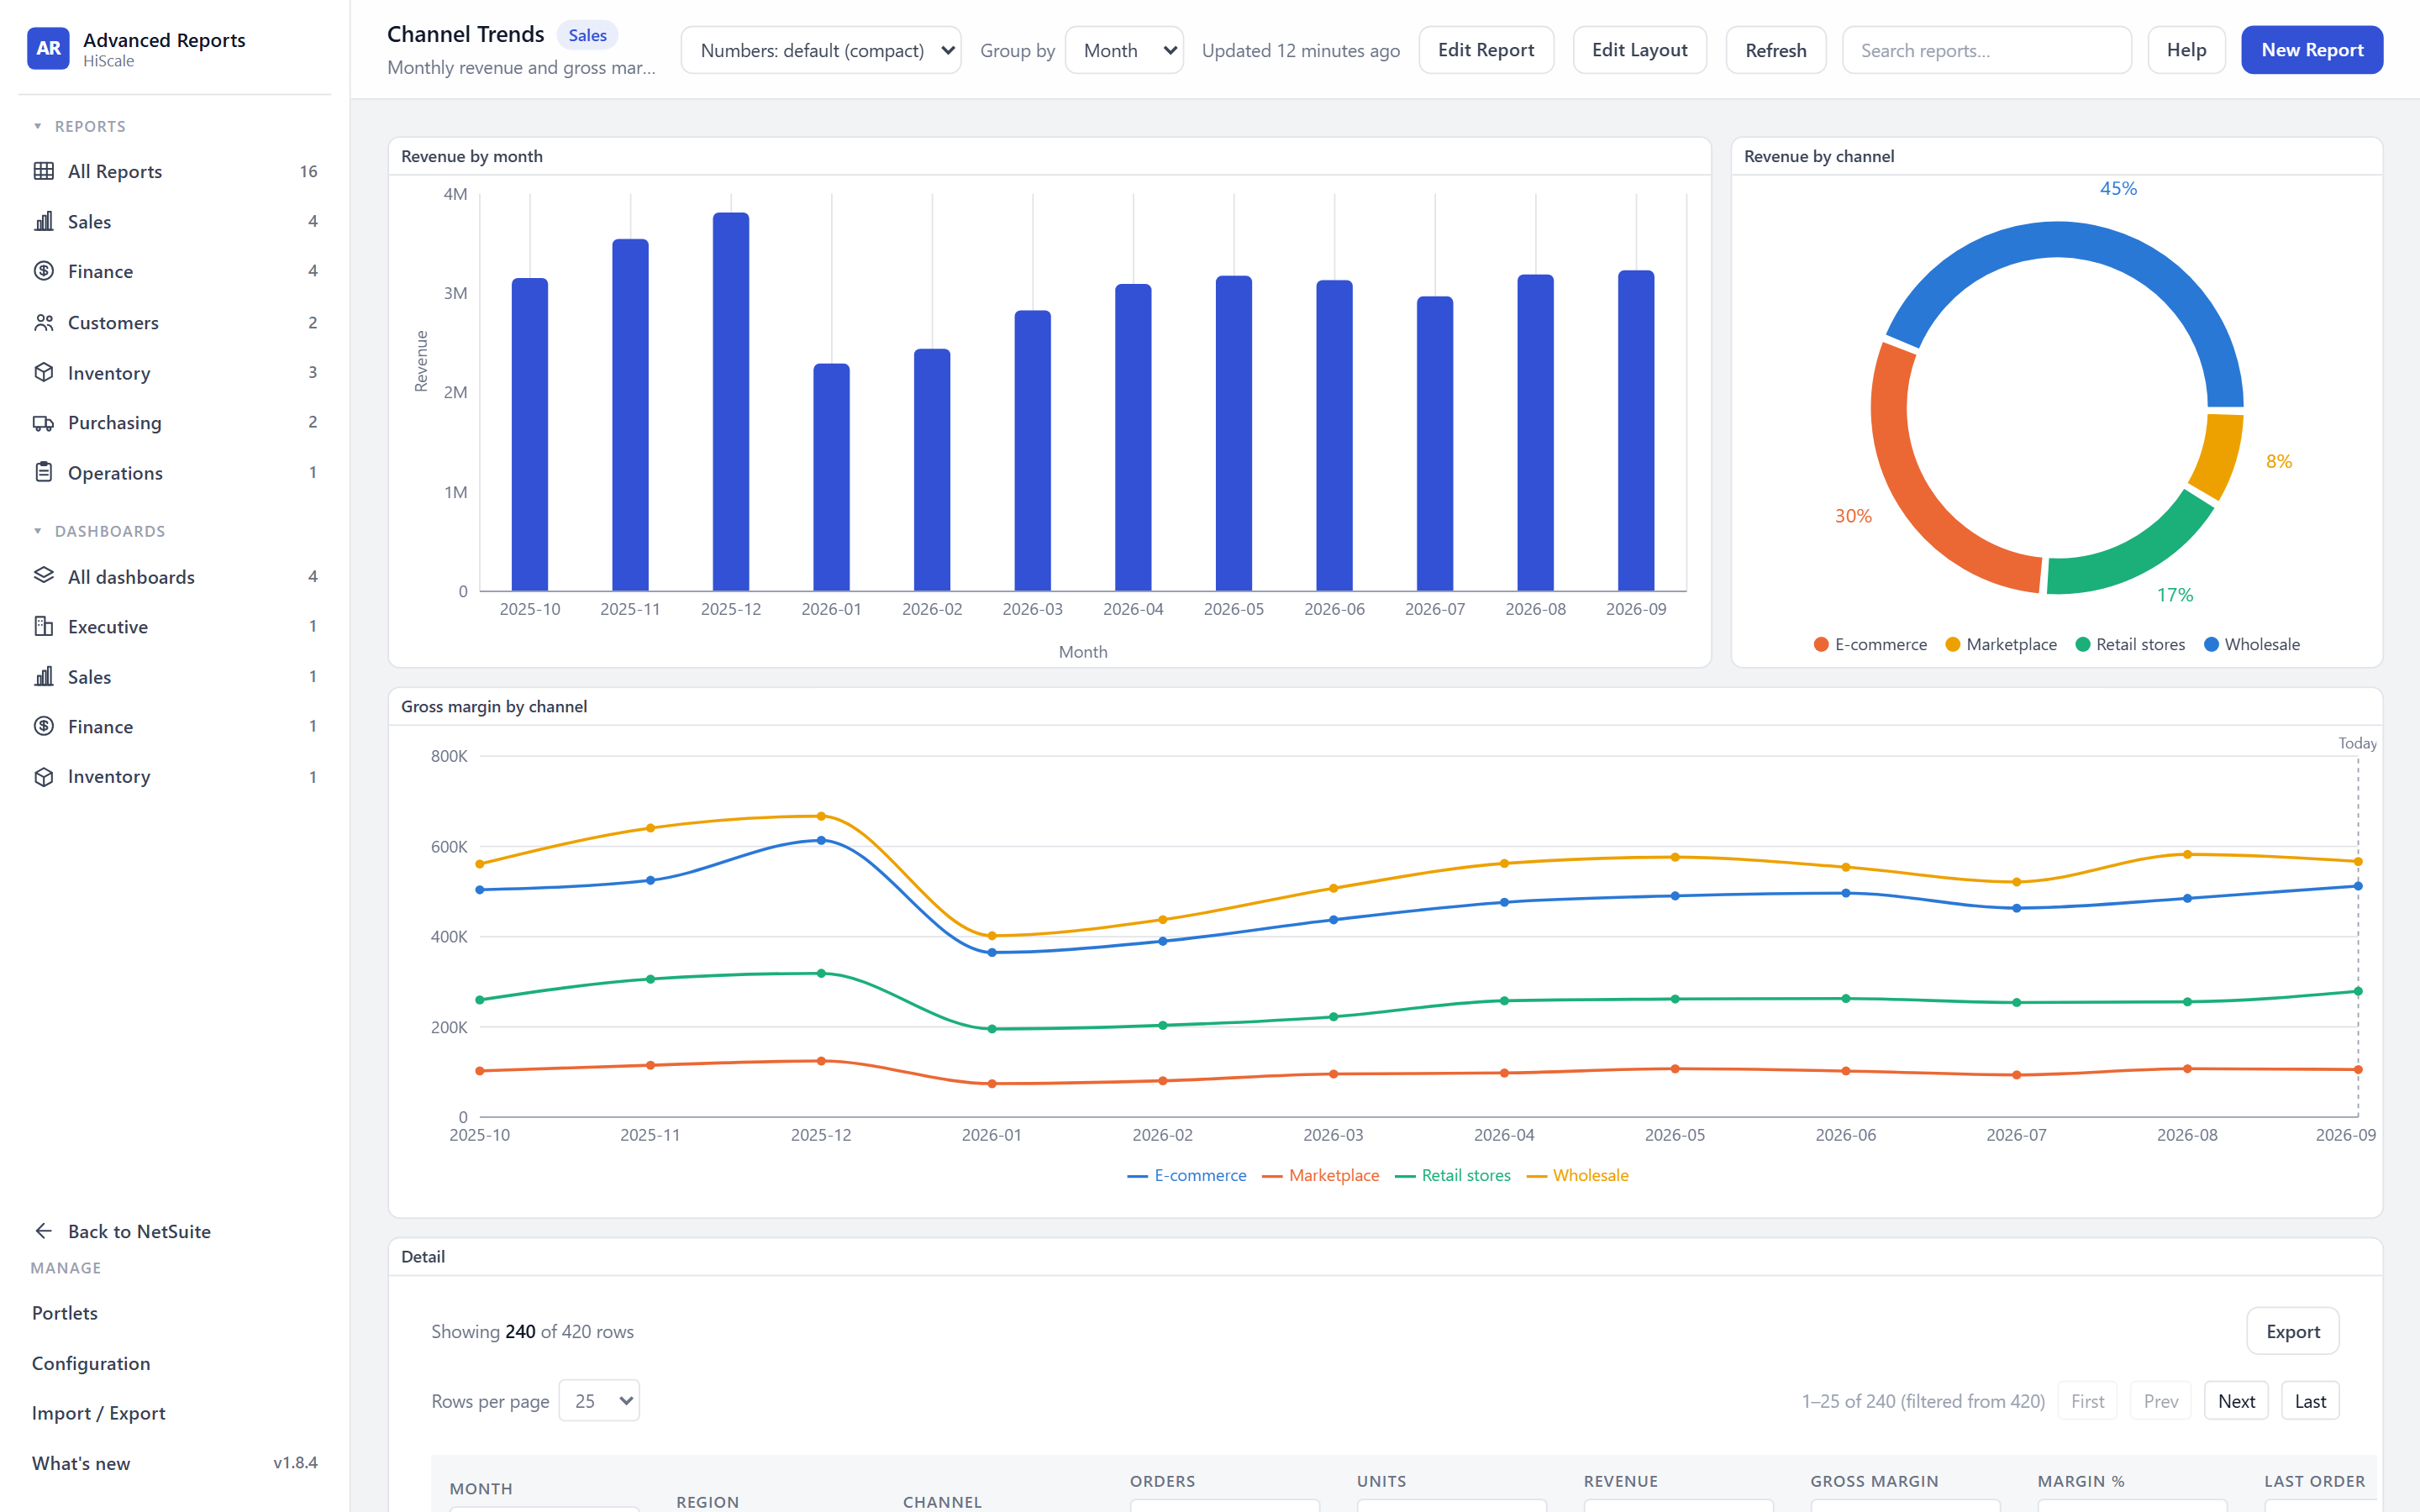
  • Line charts with a series, a dashed future and a Today marker
  • A filter bar routed to the matching column of every widget
  • A report opened from a widget keeps the dashboard's filters
More on dashboards
Channel Trends report with a bar chart of revenue by month, a donut chart of revenue by channel and a line chart of gross margin by channel over twelve months, above the detail table.
03Portlets

Your numbers on the NetSuite home page.

Any widget a report layout can show becomes a portlet on a NetSuite dashboard, so the figure people check every morning is where they already are.
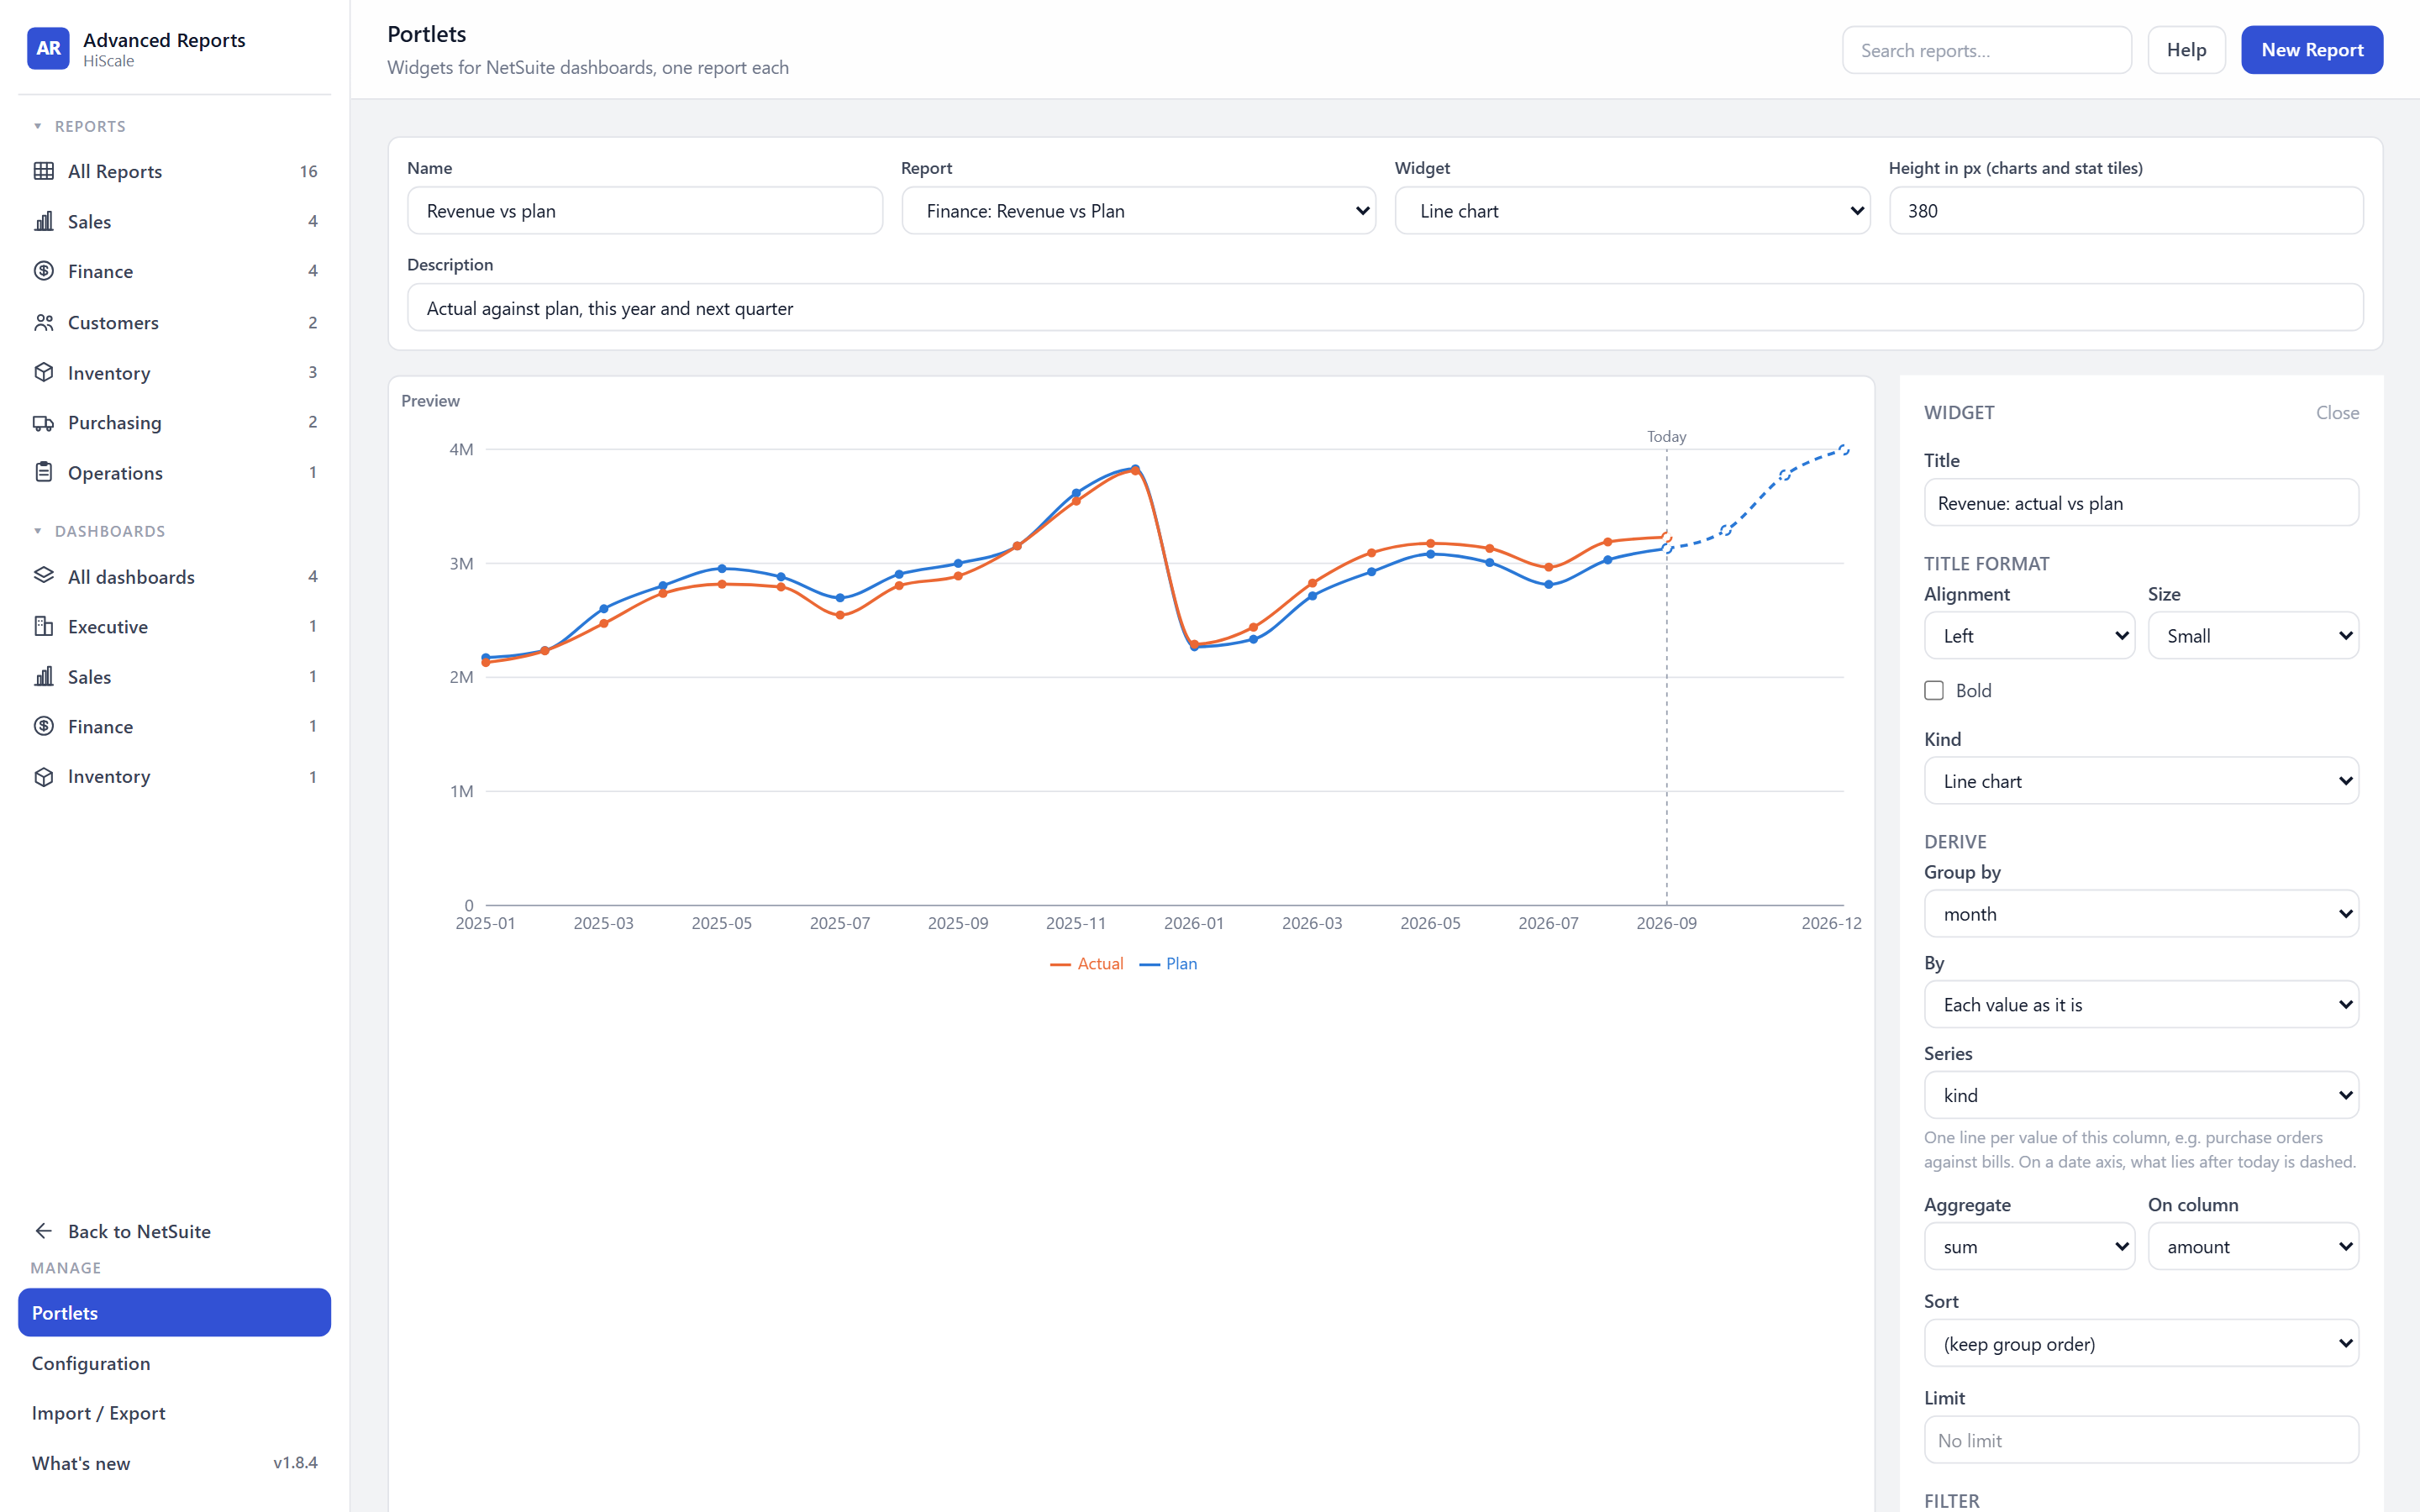
  • Defined in the app with the same panel and a live preview
  • Deployed with the report's audience, and re-synced when it changes
  • Open report from the portlet goes straight into the full view
More on portlets
Portlet editor with name, report, widget type and height fields, a live preview of a revenue actual versus plan line chart, and the widget settings panel.
How it gets into your account

Start from the Library, not a blank query.

The Library holds ready-made reports, dashboards and portlets. Pick what you need and it hands you one .json file. Import it under Manage, and the app shows exactly what it will add, update or archive before anything is written.
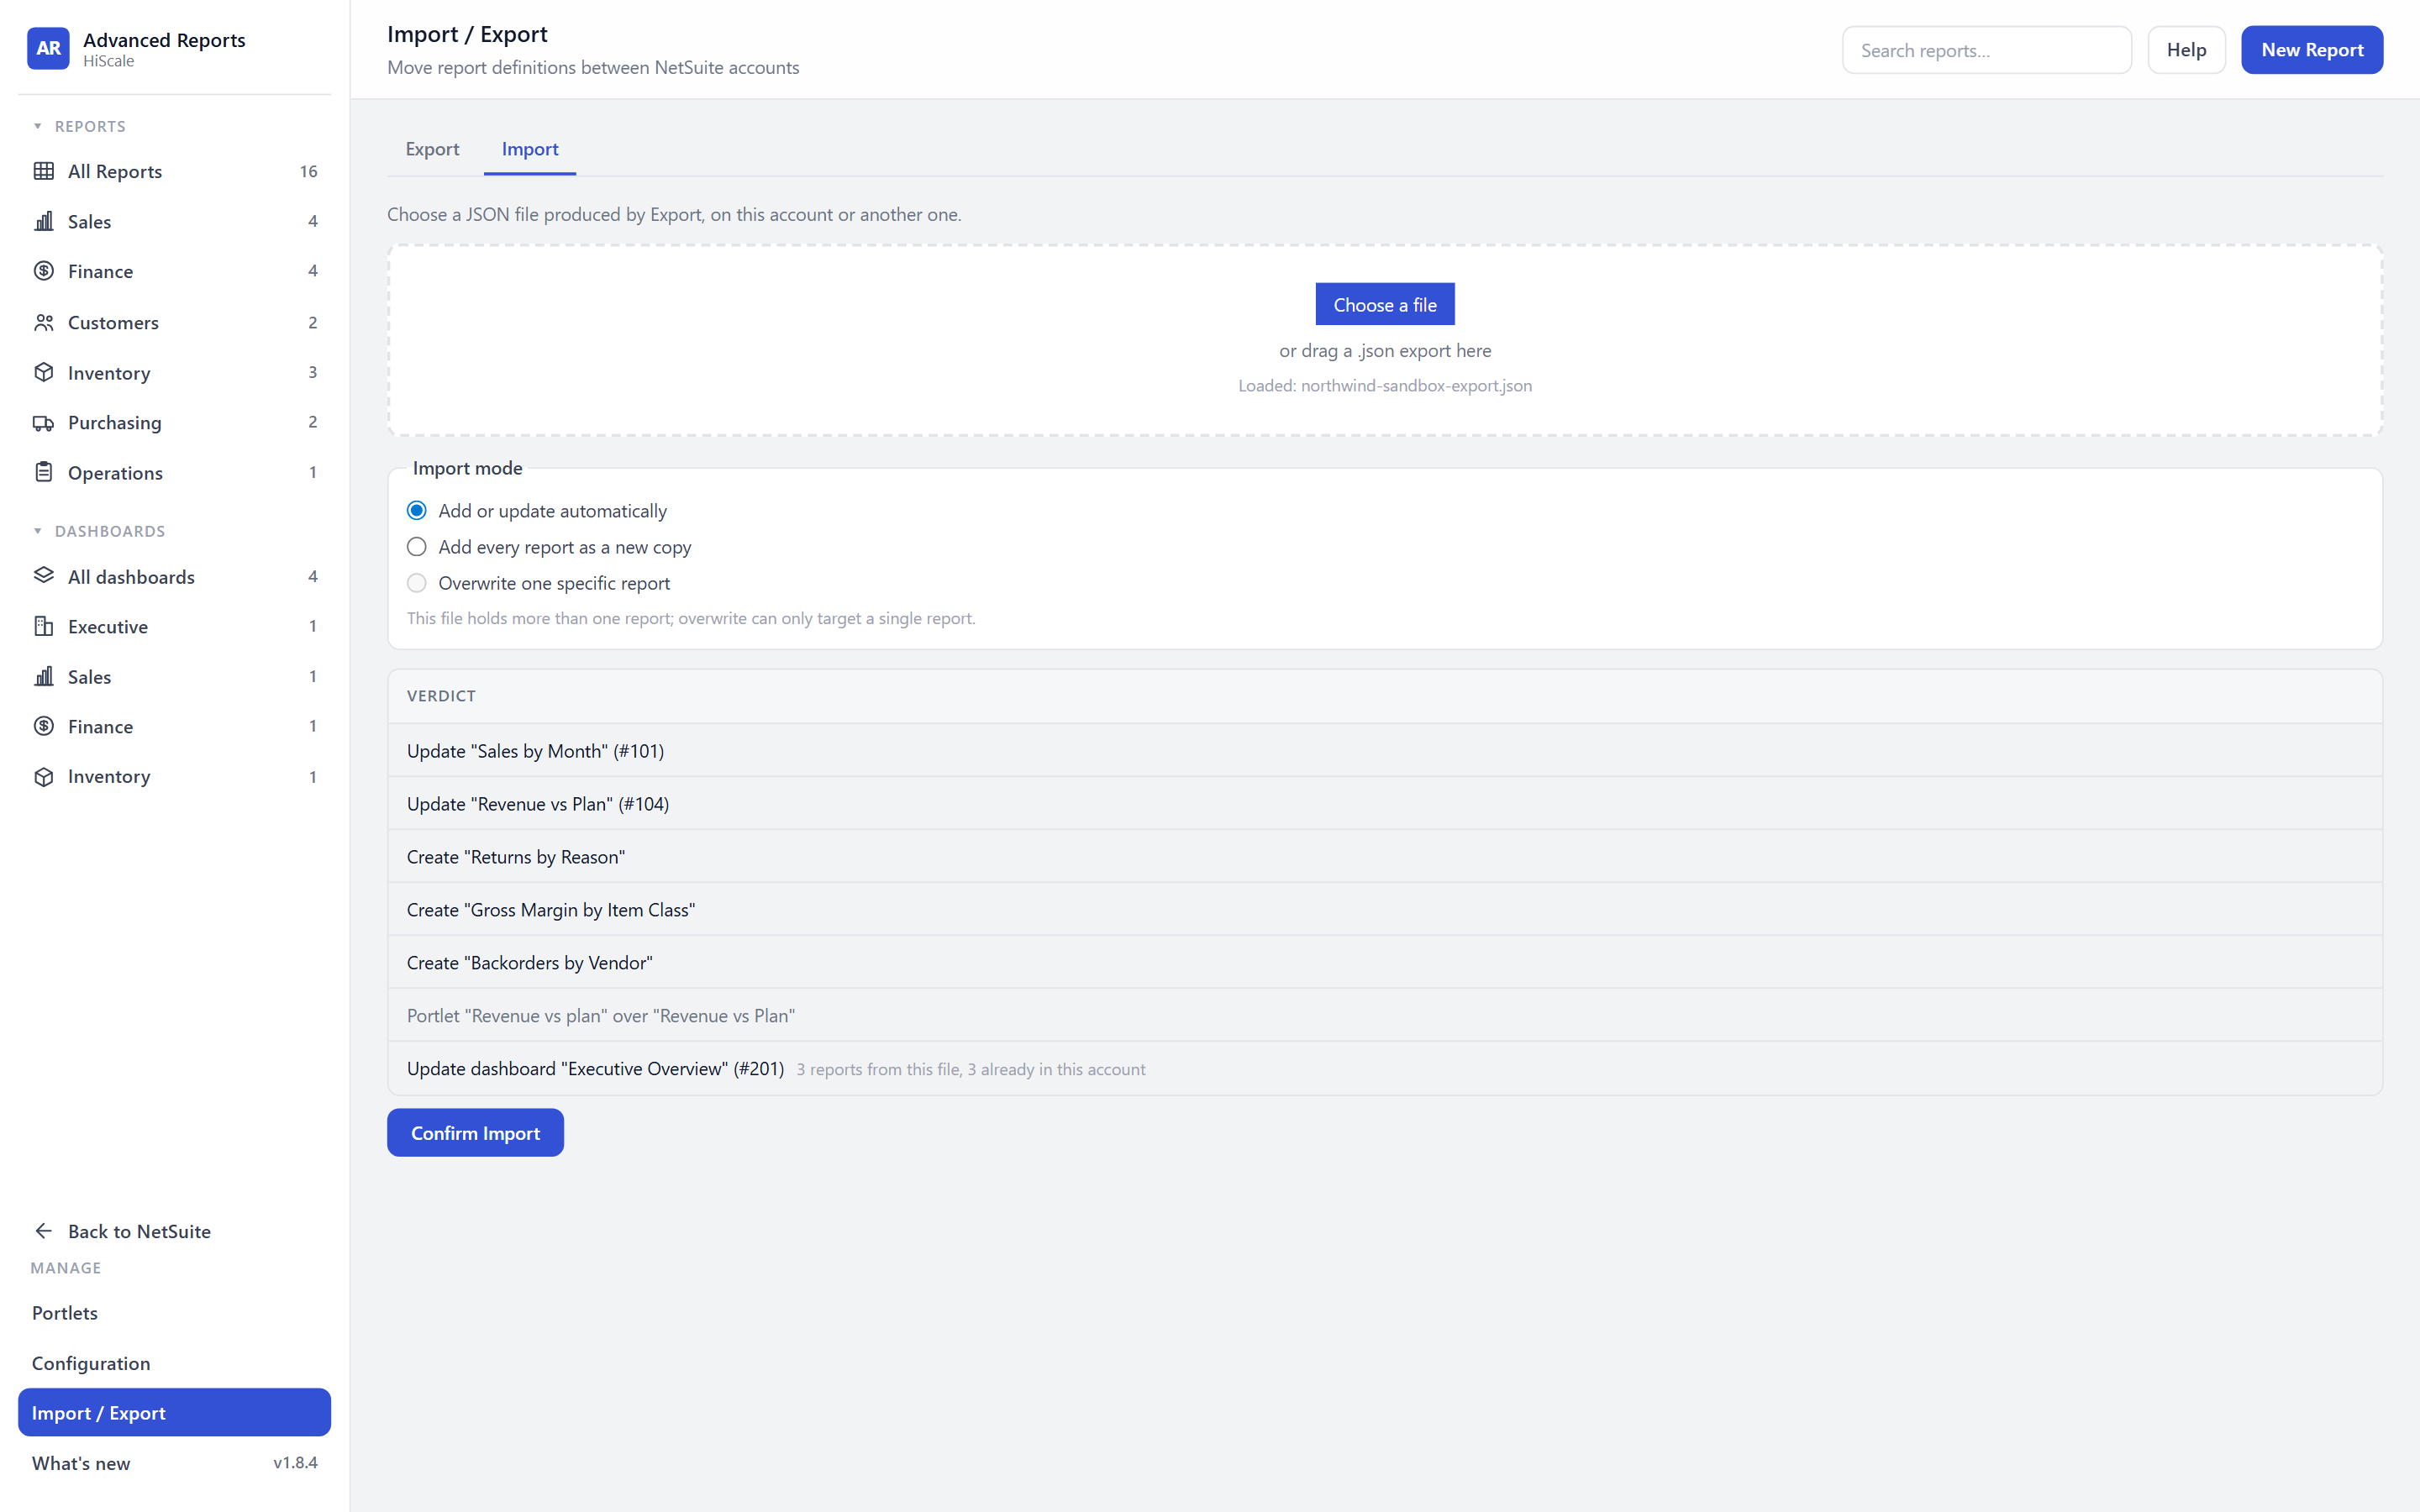
Import / Export page on the Import tab after loading an export file, showing the import mode options and a verdict listing reports to update or create, a portlet and a dashboard to update, with a Confirm Import button.
  1. Step 1

    We install the app

    HiScale deploys Advanced Reports into your account as a SuiteCloud project, sandbox first. It works in OneWorld and non-OneWorld accounts alike.

  2. Step 2

    Choose from the Library

    Pick the reports, dashboards and portlets you want. The Library packages them as one import file, dashboards with the reports they read.

  3. Step 3

    Import with a preview

    Manage, Import / Export lists what the file adds, updates or archives. Items are matched by export key, so importing again updates instead of duplicating.

  4. Step 4

    Set who can see it

    Nothing about access travels in a file. Choose the audience for many reports at once from the catalogue, and the portlets follow.

Where it runs

Runs natively in NetSuite. No external servers. Your data never leaves your account.

There is nothing to host and nothing to sync. The app is a SuiteCloud project in your account, its queries are SuiteQL, and its results are files in your File Cabinet, read through your roles.

LineAmount
Runs onNetSuite SuiteCloud
Servers outside your account0
Results stored inYour File Cabinet
Who can open a reportYour NetSuite roles
Accounts supportedOneWorld and non-OneWorld
Data leaving your accountNone
Questions we hear first

Is it really native?

Is it a native SuiteCloud app?
Yes. Advanced Reports is a SuiteCloud project deployed into your account: Suitelets, a Map/Reduce and its own custom records. Every report is SuiteQL that NetSuite itself runs.
Does it use external servers?
No. Queries run in your account, results are stored as files in your File Cabinet, and every page is served by a Suitelet. Nothing is hosted outside NetSuite and no data leaves the account.
Does it work with our NetSuite roles?
Yes. People sign in with their usual NetSuite login. Each report and dashboard has an audience of roles, subsidiaries, departments or employees, enforced on the server, and portlets follow it.
How is it installed and removed?
Like any SDF app. HiScale deploys it to a sandbox first, then to production. To remove it, you delete its scripts, custom records and files from your account, as with any SDF customization. Your data was never copied anywhere, so there is nothing to get back.

See your own numbers in Advanced Reports.

A 30-minute demo with the people who build it. Bring the report your team rebuilds in a spreadsheet every month, and we will show it to you as a report, a dashboard and a portlet.