
Commentary on a widget
Write a few sentences on any widget, with figures that follow the data, the filters and the Group by.
A commentary is your own text on a widget: what the figures say, in your words. You insert the figures from a list in place of typing them, so the text follows the data. When the report is rebuilt, a filter changes or the Group by changes, the figures in the text change with the widget. Every widget kind can carry one, in a report layout and on a dashboard.
What you can write
| You type | You get |
|---|---|
| A blank line | A new paragraph |
A line that starts with - | A point with a bullet |
A line that starts with 1. | A numbered point |
| Two asterisks before the words and two after | Bold |
| One asterisk before the words and one after | Italic |
Everything else is shown as the characters you typed. A commentary has no links, no pictures and no HTML.
Add a commentary
- In the gear menu, choose Edit Layout on a report, or Edit dashboard, and select the widget.
- In the side panel, open Commentary.
- Type your text in the box.
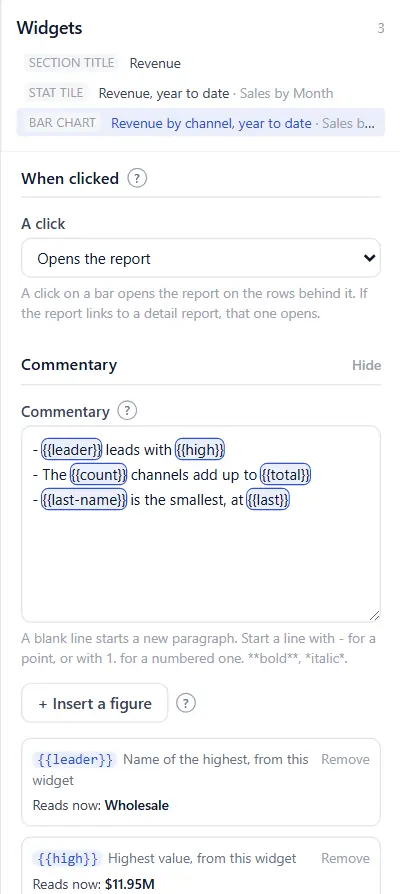
- Put the cursor where a figure goes and choose + Insert a figure.
- Under From, choose where the figure comes from. Under Figure, choose the figure. The line under the lists says what it reads now.
- Choose Insert. The figure appears in the text as a name between double braces, such as
{{total}}, on a coloured mark. - Check the Preview at the foot of the section. It shows the commentary as a reader gets it, with the figures of the moment.
- Save the layout or the dashboard.
The figures on offer
This widget lists what the widget already works out.
| Widget | Figures |
|---|---|
| Stat tile | The figure, what it is compared with, the change, the change in percent, the target, the gap to target, the date it is as of, the periods it covers |
| Bar, horizontal bar, line, pie and donut charts, and a grouped table | The total of what is shown, the total of everything, the total of the ones a Limit hides, the share shown, how many are shown and how many there are, the highest and the lowest with their names, the first and the last with their names, a bar or point by its name, and the change between two of them as an amount or in percent |
| Comparison table and Statement | Any figure, by its line and its column |
| Comparison trend | The two totals, the change and the change in percent, the names of the two periods. With more periods or a second measure, these are still the first measure's figures for the period reported and its first comparison. |
| Table of rows | How many rows, and the total of a column |
Another widget lists the same figures for any other widget of the dashboard, the ones on other pages included. The text keeps reading that widget when you move it, resize it or give it another title.
The page lists the filters in effect, each filter on its own, the Group by, today's date and the names of periods, such as Oct 2026, Q4 2026 or 2026 to date.
A bar or a point can be named three ways without its name: The last one, The one before the last and The first one. Use these for a chart over time, so the text reads the latest month every month.
How a figure is written
Under the text box, each figure of the commentary has a line with what it reads now.
| Setting | What it does |
|---|---|
| Written | As it is writes the figure as its widget does. With its sign adds a plus or a minus. No sign drops it, for a sentence that says "down" itself. |
| As a word | Writes a word in place of the figure, chosen by its sign: up above zero, down below, and a third word at zero. Choose a ready pair, such as ahead of / behind, or My own words. |
| Short form | Writes 1.2M in place of 1,200,000. |
| Green when it moved the good way, red the bad way | Offered on a change or a gap. It follows what the widget says is good: a rise in a cost shows red when the tile says a lower figure is good. |
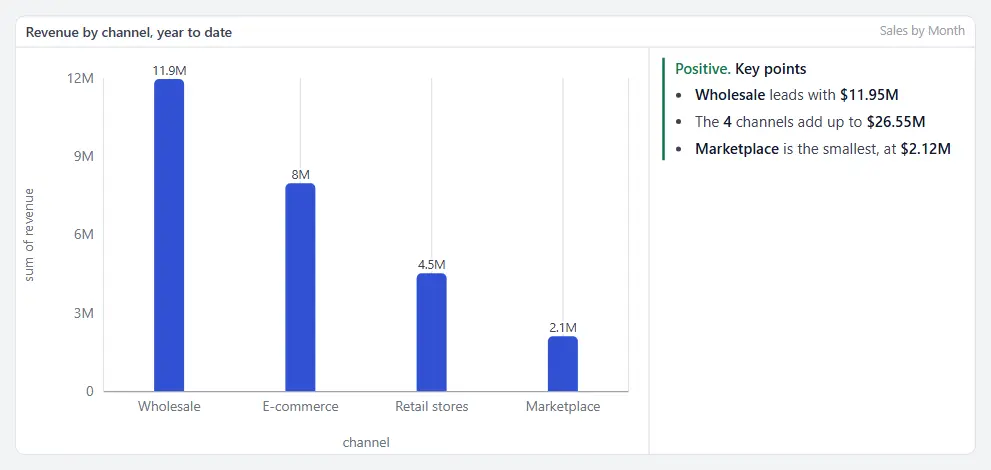
To write "Revenue is $1.2M, down 4% on last year", insert the figure, then the change as a word, then the change in percent with No sign.
Remove takes a figure out of the list and its name out of the text.
Where it sits
| Where it sits | What you get |
|---|---|
| Under the widget | The text across the foot of the card, under a thin line. The default. |
| Beside it, on the right or on the left | The text in about a third of the card, beside the widget. |
| Above the widget | The text between the title and the widget. |
- A card narrower than about 560 pixels puts a commentary set beside the widget under it, so the widget is not squeezed.
- On paper and in a PDF, a commentary set beside the widget goes under it.
- A commentary is never cut and never scrolls. When the text needs more room than the card has, the card grows and the widgets under it move down.
Heading adds a short line in bold over the text. Tone draws a coloured line down the left of the text and writes the word before it: green for Positive, amber for Warning, red for Risk.
A page of conclusions
The Text note widget is a commentary on its own. Add a text note, type your text, and insert figures from any widget of the dashboard. A note saved before 1.16.14 looks as it did until you edit it.
What a reader may see
A figure reads only what its widget shows to the person reading. A widget over a report the reader may not open shows nothing, and a figure of that widget reads as a dash, in the widget's own commentary and in a note.
In emails, PDFs and print
- A scheduled email writes each commentary under its widget, or above it where you set it above. The commentary of a stat tile is written under the row of tiles, with the tile's name.
- A PDF does the same.
- An Excel attachment has a Commentary sheet, with one row for each widget that has one.
- Print this page prints the commentary in its card.
- The figures are worked out when the email is sent or the page is printed, with the filters of that email or that page.
If something looks wrong
| What you see | What to check |
|---|---|
| A dash where a figure should be | The widget it reads has nothing to show under the filters in effect, or the comparison has nothing to compare with. In the editor, the figure's line says Figure not available. |
| A dash for one reader and a figure for another | The first reader may not open the report behind the widget. |
| Figure not available, with "a widget that is no longer here" | The widget the figure read was removed. Remove the figure and insert it again from another widget. |
| A name between braces marked in red in the box | The name has no figure. You typed it by hand or removed its figure. Choose Remove on its line, then insert the figure. |
| The text is under the widget though you chose beside | The card is too narrow for both. Make the widget wider. |
| An account on an older version | A version before 1.16.14 shows the widget without its commentary, and a note as its words with the name of each figure in brackets. |
Related: Building a dashboard · Ranked tables and a chart's total · Sections, pages and present mode · Dashboard filters · Scheduled emails · Charts on a report