
Formatting numbers, currencies, percentages and dates
Set how values read across the account on the Formatting tab, give one report column its own decimals, compact style, negatives and percent reading, and give one chart or tile its own number format.
Three places decide how a number, an amount, a percentage or a date is written. An admin sets the account's defaults on the Formatting tab. An author can give one column of a report its own formatting in the report wizard, and the column wins over the account. A chart, a stat tile or a comparison trend can also set its own number format, and that wins over the column for that widget only.
The same rules apply in tables, totals rows, stat tiles, charts, the statement widget, printed pages, exports, emails and PDFs. Until someone changes a setting, every value reads as it did before version 1.16.7.
Which setting wins
| Level | Where | Applies to |
|---|---|---|
| The widget | Widget panel, How it looks, Number format | That chart, stat tile or comparison trend only |
| The column | Report wizard, Columns, Formatting under the column's format | That column, wherever it is shown |
| The account | Manage, Configuration, Formatting | Every column that sets nothing for itself |
| The viewer | Their NetSuite preferences, then their browser | The settings left on Follow each viewer |
Set the account's defaults
Only admins can open this page.
- Open Manage, Configuration and choose the Formatting tab.
- Change a setting. The Sample beside it shows at once what you would see with that choice.
- Choose Save Changes. Pages opened from then on use the new settings. A page already open uses them after a reload.
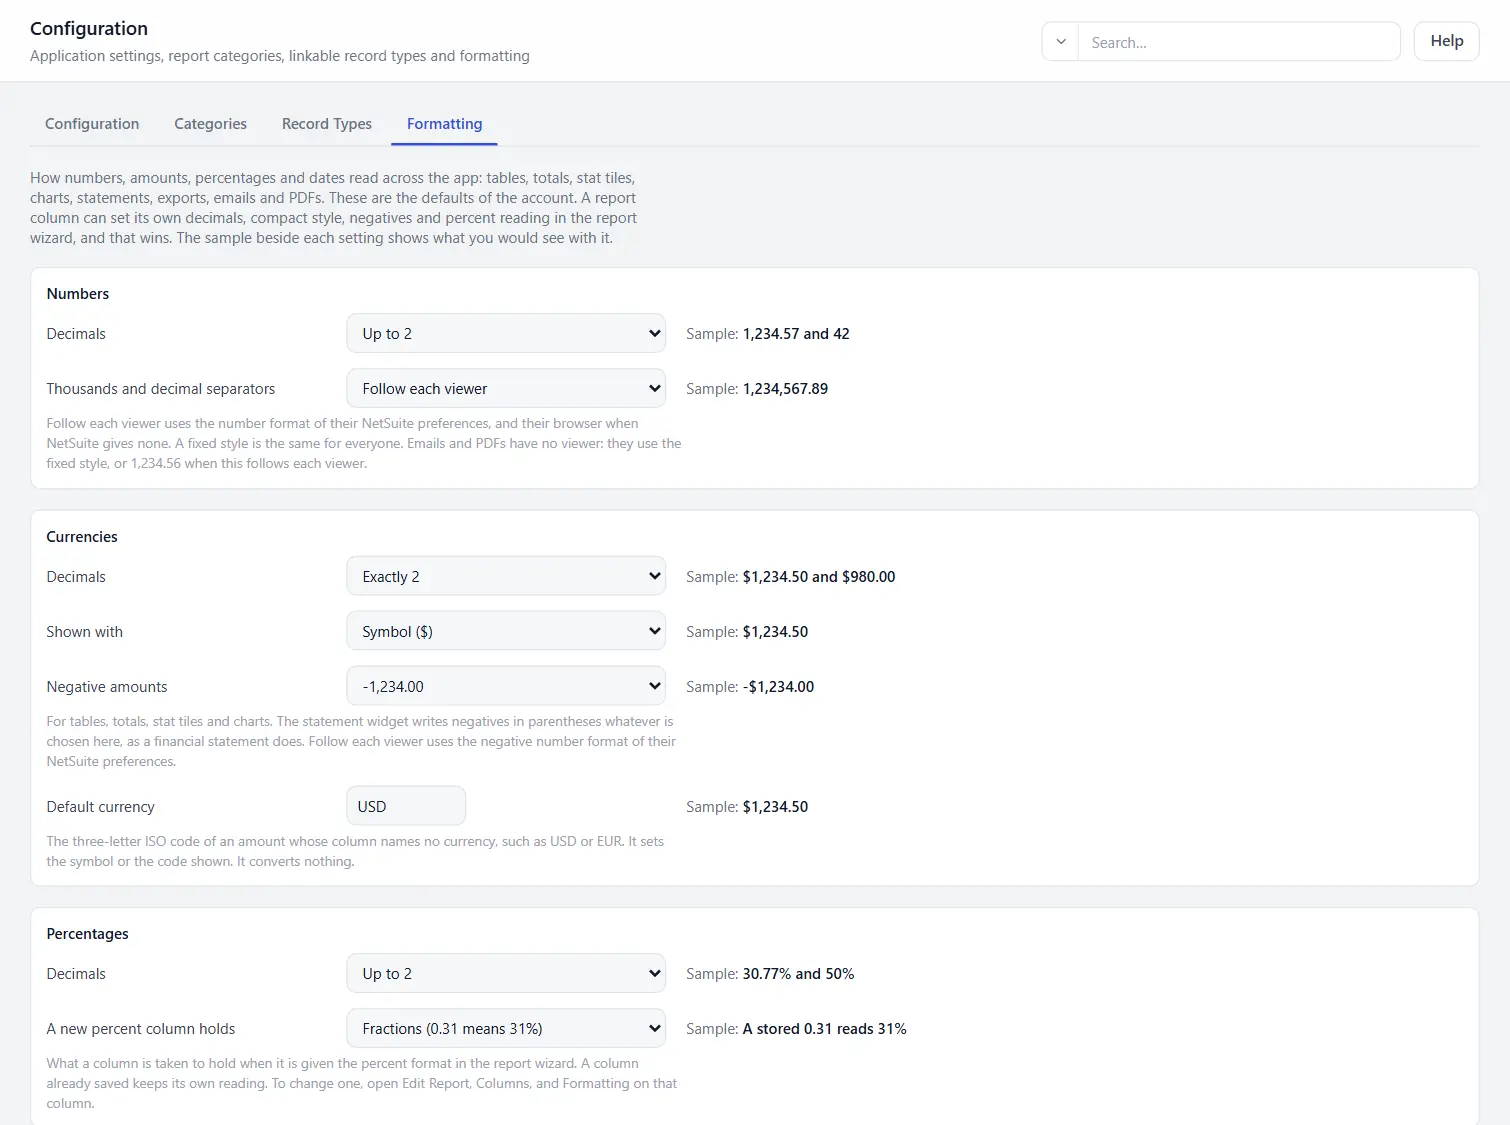
The last section of the tab, Fiscal year, sets the month the fiscal year starts in. It is covered in Fiscal periods, year to date and balances.
Numbers
| Setting | Choices |
|---|---|
| Decimals | None, Up to 2 (the default), Exactly 2, As stored |
| Thousands and decimal separators | Follow each viewer (the default), 1,234.56, 1.234,56, 1 234,56, 1'234.56 |
As stored shows every decimal the query returned.
Currencies
| Setting | Choices |
|---|---|
| Decimals | The same four choices, set apart from numbers. The default is Exactly 2. |
| Shown with | Symbol ($), the default, ISO code (USD), or Neither |
| Negative amounts | -1,234.00, the default, (1,234.00), or Follow each viewer |
| Default currency | A three-letter ISO code, USD to begin with |
The default currency is the currency of an amount whose column names none. It sets the symbol or the code shown. It converts nothing.
The statement widget writes negatives in parentheses whatever Negative amounts says, as a financial statement does. Choose (1,234.00) here if you want tables, totals and stat tiles to read the same way.
Percentages
| Setting | Choices |
|---|---|
| Decimals | The same four choices. The default is Up to 2. |
| A new percent column holds | Fractions (0.31 means 31%), the default, or Already percentages (31 means 31%) |
The second setting applies when an author gives a column the percent format in the wizard. A column already saved keeps its own reading. See "A percent column shows 3,077%" below.
Dates and times
| Setting | Choices |
|---|---|
| Date style | Follow each viewer (the default), Each viewer's NetSuite date format, Oct 25, 2026, 25 Oct 2026, 10/25/2026, 25/10/2026, 25.10.2026, 2026-10-25 (ISO) |
| Clock | Follow each viewer (the default), 12 hour (3:45 PM), 24 hour (15:45) |
| Time zone shown | Each viewer's time zone (the default) or The account's time zone |
The time zone applies to a stored value that names its own zone, such as 2026-10-25T15:45:00Z. A value with no zone is shown as written, in every zone. The account's time zone is the one under Setup, Company, Company Information.
Compact figures
A compact figure is written short: 1.2M for 1,200,000.
| Setting | Choices |
|---|---|
| Stat tiles | In full (the default) or Compact (1.2M) |
| Chart axes | Compact (1.2M) (the default) or In full |
The setting for stat tiles applies when nobody chose a Numbers style. A layout set to compact, and a viewer's own Numbers choice on the page, still win. See "Full or compact numbers" in Reading a report.
Empty and zero
| Setting | Choices |
|---|---|
| An empty value shows | Blank (the default), A dash (-), or 0 |
| A zero shows | 0 (the default) or A dash (-) |
These two apply to numbers, amounts and percentages in tables, totals rows and statements. A stat tile and a chart always show a zero as a figure.
Charts
| Setting | Choices |
|---|---|
| Chart font | The app's font (the default), Helvetica (Arial), Times or Courier |
The font of the text of every chart: its axes, the values written on it, the key and the hover card. The sample is written in the font chosen. A widget can choose its own font and text size under How it looks, and that wins. Each choice is a font that browsers and NetSuite's PDF engine both have. An email uses it where the mail reader has it, and its own font otherwise. See Charts on a report.
What Follow each viewer means
A setting on Follow each viewer is written for each person the way they read it elsewhere:
- Separators, the Clock and the time zone use the person's NetSuite preferences (Home, Set Preferences), and their browser when NetSuite gives none.
- Negative amounts on Follow each viewer uses the Negative Number Format of their NetSuite preferences.
- Date style on Follow each viewer writes the date in the language of their browser, as the app always has:
Oct 25, 2026in English. Choose Each viewer's NetSuite date format to use the Date Format of their NetSuite preferences.
A fixed choice is the same for everyone.
Emails and PDFs have no viewer. The server writes them with the fixed choices of the tab. Where a setting follows each viewer, an email or a PDF reads 1,234.56 and Oct 25, 2026, as it always did. To send emails in another style, choose that style on the tab.
Give one column its own formatting
Authors do this in the report wizard.
- Open the report and choose Edit Report, then the Columns step.
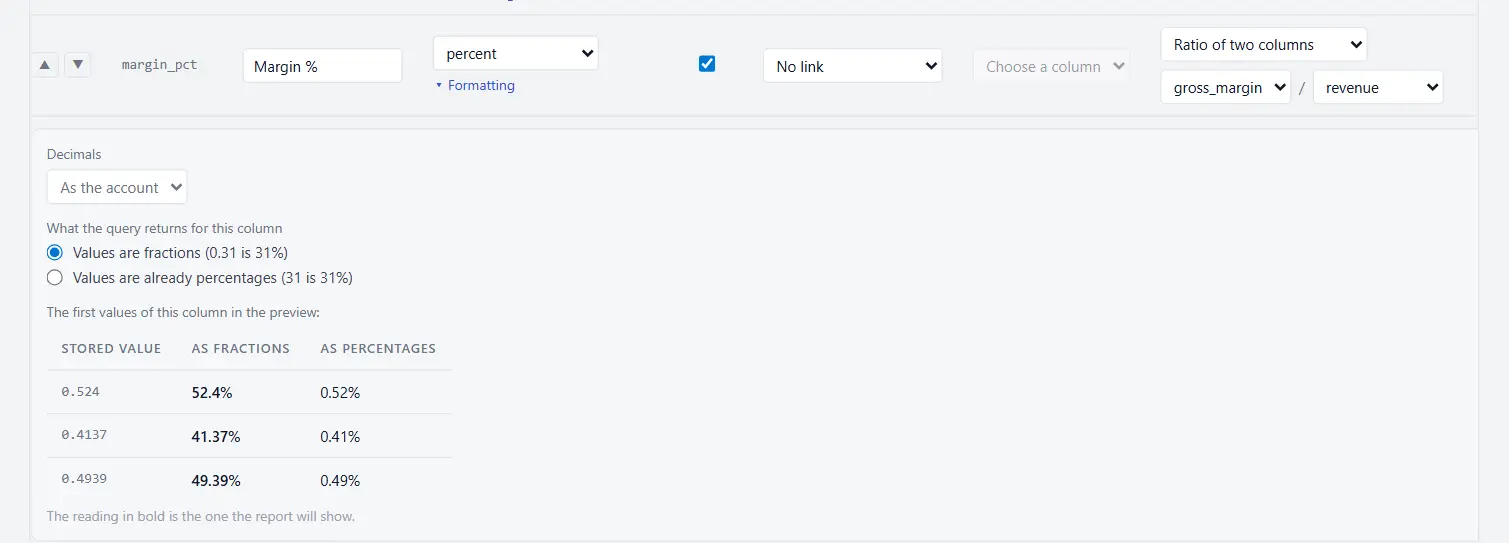
- Under the column's Format, choose Formatting. Number, currency, percent, date and datetime columns have it.
- Set what the column needs. Every choice starts on the account's setting.
- Read the sample under the choices. It writes the first values of that column with what you chose.
- Choose Save.
| Choice | Columns | What it does |
|---|---|---|
| Decimals | Number, currency, percent | None, up to 2, exactly 2 or as stored, for this column |
| Compact (1.2M) | Number, currency | Always compact or Always in full. As the page follows the page's Numbers style. |
| Negatives | Number, currency | -1,234.00 or (1,234.00) |
| Currency code | Currency | The column's currency as an ISO code. Leave it empty for the account's default. |
| What the query returns for this column | Percent | Values are fractions (0.31 is 31%) or Values are already percentages (31 is 31%) |
| Date style | Date, datetime | One fixed style for this column |
The sample comes from the stored result of the report. After you choose Preview on the Query step, it comes from that preview. A report that never ran has no sample yet.
A closed column says in a few words what it sets, for example "already percentages, exactly 2 decimals".
The column's formatting is part of the report. Make a Copy keeps it, and so do Import / Export and a report update sent to an account. A file exported before version 1.16.7 imports unchanged.
Give one widget its own number format
A chart can read differently from the grid without changing the report. For example, the average of a plain number column can read as US dollars with two decimals on a bar chart, while the report's grid keeps the plain number.
- Open the layout editor or the dashboard editor and select the widget.
- Open How it looks and find Number format. Bar, horizontal bar, line, pie, donut, stat tile and comparison trend widgets have it.
- Set what the widget needs. Every choice starts on following the column, which stores nothing.
- Read the sample under the choices. It writes the widget's own first figures with what you chose, and says what an axis tick reads.
- Save the layout.
| Choice | What it does |
|---|---|
| Show as | Follow the column (the default), Number, Currency or Percent. A comparison trend starts on Plain number, which is how it has always written its figures. |
| Decimals | None, up to 2, exactly 2 or as stored |
| Currency code | With Currency: an ISO code, such as USD. Leave it empty for the column's currency, then the account's default. |
| The values are | With Percent: fractions (0.31 is 31%) or percentages already (31 is 31%) |
| Figures | Compact (1.2M) or In full |
| Negatives | -1,234.00 or (1,234.00) |
Each choice left as it is falls back to the column, then to the account. A count and a distinct count of a column are plain whole numbers, whatever the column's format, until the widget says otherwise. An average or a sum keeps the column's format.
A widget set to Compact or In full keeps it whatever the page's Numbers choice says, as a column set that way does. A widget that leaves Figures as it is follows the column, then the page.
The choice reaches every place the widget's figures are written: the axis, the values on the bars and points, the reference line labels, the hover card, the legend totals of a comparison trend, a stat tile's figure, comparison, change, target and gap, a commentary figure read from the widget, Print, portlets, the scheduled email, the PDF and the Excel cells. A chart or a comparison trend with a second measure has a second set of choices for that measure. A comparison trend with a second measure writes each measure as its column does, so its first measure starts on Follow the column rather than Plain number.
The axis stays short: it writes the currency symbol of a widget set to Currency ($150, $1.5K) but no trailing zeros. The values on the bars and points, and the reference line labels, use the widget's decimals ($156.59).
The comparison table and the statement do not have this section. Each of their columns already has its own decimals, negatives and compact choice.
A percent column shows 3,077%
The percent format reads a stored value as a fraction by default: 0.3077 shows as 30.77%. When the query already multiplies by 100, the stored value is 30.77 and the column shows 3,077%.
Point at a cell to check. The hover box says, for example, Stored value: 30.77.
To fix the column without changing the query:
- Open the report and choose Edit Report, then the Columns step.
- Choose Formatting under the format of the percent column.
- Look at the sample. It shows the first values of the column As fractions and As percentages. One of the two is the figure you expect.
- Choose Values are already percentages (31 is 31%).
- Choose Save. The column reads 30.77% at once. The report does not need a refresh, because the stored values did not change.
When most values of a percent column are above 1.5, the step shows a note that suggests the other reading. It is a suggestion. The app never changes the reading by itself.
The reading follows the column everywhere:
- Totals, stat tiles and charts. A sum or an average of the column reads with the column's reading.
- Filters. You type the figure you see. To keep 10% to 50%, type 10 and 50, on a column of fractions and on a column of percentages alike. The boxes of a percent column's filter are marked with a % sign.
- Group by quarter or year. A Ratio of two columns roll-up gives the column a percentage when it holds percentages.
- Excel. The cell keeps the stored number, and Excel shows the figure of the page: 30.77 stays 30.77 and reads 30.77%.
- CSV. The file holds the stored value.
- Emails and PDFs. They read the column as the page does.
A filter saved before version 1.16.7 keeps its meaning. On a column of fractions, a saved "at least 0.5" now shows as 50 in the filter box.
Exports
A CSV file holds the stored values, with no formatting.
An Excel file keeps the stored numbers and applies a number format to the cells:
| Column | Excel shows |
|---|---|
| Currency | Two decimals, or what the column or the account sets |
| Percent of fractions | A percent format: 0.3077 reads 30.77% |
| Percent of percentages | The number with a % sign: 30.77 reads 30.77% |
| Number | Excel's own General format, unless the column or the account sets no decimals or exactly 2 |
The table of values of a chart in an emailed workbook takes the chart's own number format when it sets one: an average shown as currency with two decimals is a cell with two decimals. Excel does not write the currency symbol in the cell.
Excel writes separators and dates in the style of the person who opens the file, not in the style of the Formatting tab.
If something looks wrong
| What you see | Why, and what to do |
|---|---|
| A percentage is 100 times too large | The column holds percentages and reads them as fractions. Set Values are already percentages on the column, as described above. |
| A percentage is 100 times too small | The column holds fractions and is set to Values are already percentages. Set it back to Values are fractions. |
| I changed a setting and my page did not change | A page already open keeps the settings it loaded. Reload it. |
| Two people read different separators on the same report | Thousands and decimal separators is on Follow each viewer and their NetSuite preferences differ. Choose a fixed style to give everyone the same. |
An email reads 1,234.56 and the page reads 1.234,56 | The page follows the viewer and an email has none. Choose the fixed style 1.234,56 on the tab. |
| A stat tile stays compact with Stat tiles on In full | The layout's Numbers style is compact, or you chose Compact under Numbers in the gear menu. |
| A chart stays compact, or in full, when I change Numbers | The widget sets Figures under Number format. Set it back to the column's choice to follow the page. |
| A chart reads differently from the report's grid | The widget sets its own Number format under How it looks. |
The statement shows (1,234.00) and the table -1,234.00 | The statement always uses parentheses. Set Negative amounts to (1,234.00) to make the table match. |
| A date with a time did not move to the account's zone | The stored value names no zone, so the app shows it as written. |
| Save Changes is greyed | Nothing changed, or Default currency is not three letters. |
The keys behind these settings are listed in the Settings reference.
Related: Settings reference · The report wizard step by step · Reading a report · The Statement widget · Import and export