
Fiscal periods, year to date and balances
The fiscal year of your account in filters, Group by and comparisons, half years, year to date figures, and balances that take their month-end value.
A fiscal year that does not start in January has its own years, half years and quarters. Advanced Reports reads the month your fiscal year starts in and offers those periods wherever a period is chosen. This article also covers the half year, the year to date and balances, which every account has.
In an account whose fiscal year starts in January, the fiscal choices equal the calendar ones, so the app does not list them. Nothing else changes there.
Where the fiscal year comes from
The app needs one fact: the month the fiscal year starts in.
- Open Manage, Configuration and choose the Formatting tab. Only admins can open it.
- Scroll to Fiscal year.
- Leave The fiscal year starts in on Follow the accounting periods, or choose a month.
- Choose Save Changes. Pages you open from then on use it.
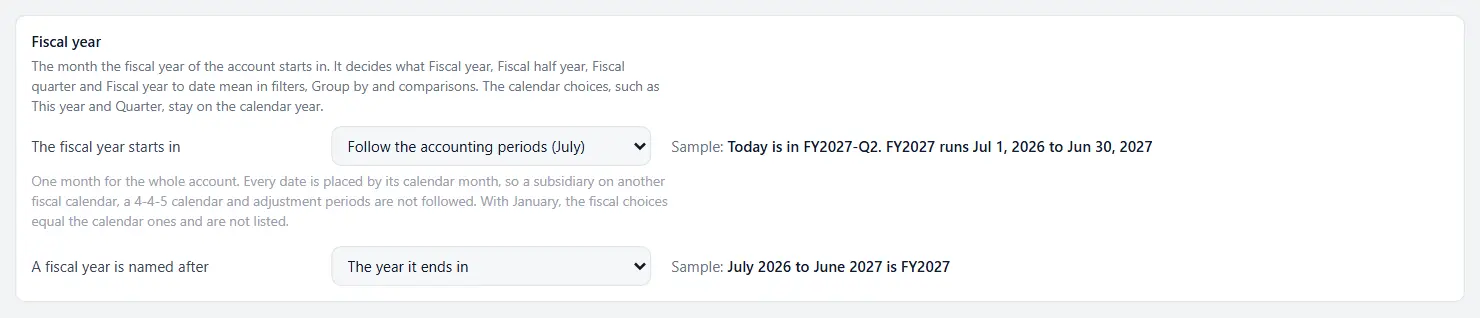
- Follow the accounting periods reads the fiscal years set up under Setup, Accounting, Manage Accounting Periods, and takes the month the most recent one starts in. The choice names the month it found.
- The sample beside the setting writes the fiscal quarter today is in, and the first and last day of the fiscal year.
- A fiscal year is named after decides the number in its name. July 2025 to June 2026 is FY2026 when a year is named after the year it ends in, and FY2025 when it is named after the year it starts in.
What the app does not follow:
- A subsidiary on another fiscal calendar. The app uses one starting month for every report. When your accounting periods have fiscal years starting in more than one month, the section says so and you choose the month.
- A 4-4-5 or 4-5-4 calendar. Every date is placed by its calendar month. A fiscal quarter here is three calendar months.
- Adjustment periods. An adjustment is counted in the month of its date.
How periods are written
A period reads the same in a chart, a table, an export and an email.
| Period | Written | Example for a fiscal year starting in July |
|---|---|---|
| Year | 2026 | January to December 2026 |
| Half year | 2026-H1 | January to June 2026 |
| Quarter | 2026-Q3 | July to September 2026 |
| Month | 2026-08 | August 2026 |
| Fiscal year | FY2027 | July 2026 to June 2027 |
| Fiscal half year | FY2027-H1 | July to December 2026 |
| Fiscal quarter | FY2027-Q2 | October to December 2026 |
Sorted as text, the periods of one kind are in time order, in a table and in Excel alike.
Filtering by a fiscal period
A date or month column has these relative ranges, beside the ones it always had:
| Range | Keeps |
|---|---|
| This fiscal year, Last fiscal year | The whole fiscal year today is in, or the one before |
| This fiscal half year, Last fiscal half year | The six months of the fiscal year today is in, or the six before |
| Same half, last fiscal year | The same six months one year earlier |
| This fiscal quarter, Last fiscal quarter | The fiscal quarter today is in, or the one before |
| Fiscal year to date | From the first day of the fiscal year through today |
| Same period, last fiscal year | The same span one year earlier, to compare a year to date with |
| This half year, Last half year, Same half, last year | The calendar half years |
| Same period, last year | January 1 through today's date of last year |
To use one:
- Open the filter under a date or month column header.
- Choose a range under Relative.
The app works the dates out again each time the page opens, so Fiscal year to date is always up to today. On a month column a range ends with the current month, as Year to date does.
Today is the day on your own clock, in your own time zone, and a period is made of whole calendar days and months wherever you are. A scheduled email and a PDF made by the server have no reader, so they use the day in your account's time zone.
This year, Last quarter and the other ranges you already use stay on the calendar year, whatever the fiscal year is.
Grouping by a fiscal period
Group by on a report page, By on a widget and the Group by of a dashboard list Half year, and in a fiscal account Fiscal quarter, Fiscal half year and Fiscal year.
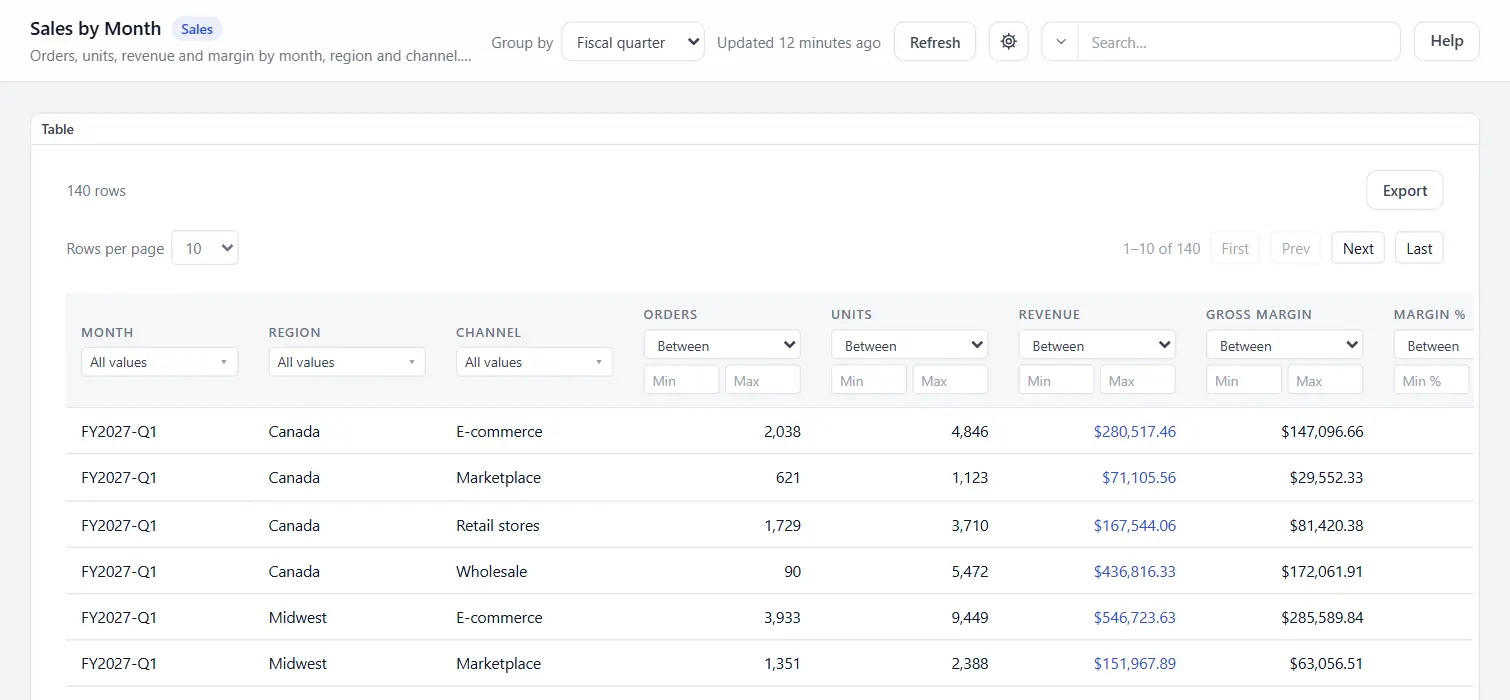
- A report stored by month rolls up to any of them in your browser.
- A dashboard's Group by lists a grouping when at least one widget that follows it can show it.
- A comparison trend draws quarters at most. Under Fiscal year or Fiscal half year it shows fiscal quarters, and says so in a small line under it.
- A click on a bar, a slice or a point opens the report on that period: its months on a month column, its first to last day on a date column.
Year to date
A year to date figure adds up everything since the start of the year or of the fiscal year.
As one figure on a stat tile:
- Select the tile in edit mode.
- Under Filter, choose Relative period, the date column, and Year to date or Fiscal year to date.
- Under Comparison and target, set Compared with. The period right before compares a year to date with the same span one year earlier. For any other period, The same period a year earlier does the same.
As a running total on a chart:
- Select a bar chart or a line chart grouped on a date or month column.
- Set Running total to Year to date, restarts each year or Fiscal year to date, restarts each fiscal year.
Each bar or point then shows the total since the start of its year, and the total starts again with the next year. A click on it opens the rows from the start of that year to the end of its period. A running total works with sum and count.
Balances
Cash, receivables and stock on hand are balances. A balance is where an account stood at a month end, so three months of it must not be added together. The balance of a quarter is the balance of its last month.
To mark a column as a balance:
- Open the report in the wizard and go to Columns.
- Set the Roll-up of the column to Last month of the period.
- Save.
What then follows:
- At Quarter, Half year, Year and the fiscal groupings, the column shows the value of the last month of each period. For a period still running, that is the latest month it has.
- A totals row offers Closing value in place of Sum. It adds up the rows of the latest period shown, across every account. A Sum saved on a balance column shows a dash.
- In a widget, choose the aggregate closing value. A chart by quarter then draws the balance at each quarter end, and a stat tile shows the latest balance. The panel says so when you add up a balance column by mistake.
- Emails and PDFs print the same figures.
To show a balance as of the end of a month:
- On a stat tile, choose the aggregate closing value on the balance column. Latest by is the month or date column.
- Set its Filter to the period that ends with that month, such as Last month, Last fiscal year or a date range.
The tile shows the balance at the end of that period, and compares it with the balance at the end of the period before.
A balance report needs a row for every month. When an account has no row for a month, the app takes the latest month it does have, which is right for a balance that carried forward and wrong for one that fell to zero. Return the zero from the query.
If something looks wrong
| What you see | Why, and what to do |
|---|---|
| No fiscal choices anywhere | The fiscal year starts in January, or the app found no accounting periods. Choose the month under Fiscal year on the Formatting tab. |
| FY2026 where you expected FY2025 | The year is named after the year it ends in. Change A fiscal year is named after. |
| A fiscal quarter does not match your period close | Your periods are not calendar months, as in a 4-4-5 calendar. The app places every date by its calendar month. |
| A balance is far too large at Quarter or Year | Its roll-up is Sum. Set it to Last month of the period. |
| A totals row shows a dash under a balance | It is set to Sum. Open Totals row and choose Closing value. |
| Closing value shows a dash | The table or the widget has no month or date column to tell which rows are the latest. |
| A file imported from another account lists one fiscal choice | The file uses it. In an account whose fiscal year starts in January it means the calendar period. |
Related: Filters and the grain switch · Dashboard filters · Building a dashboard · The report wizard step by step · Settings reference