
The Comparison table widget
Compare periods side by side, with one line for each department, customer or account, change columns, subtotals and a total.
The Comparison table widget puts periods side by side. It shows one line for each value of a column you choose, such as a department, a customer or an account, and one column for each period you choose. For example, this month, the same month last year, the change between them, the year to date and last year's. You can use it in a report layout or on a dashboard.
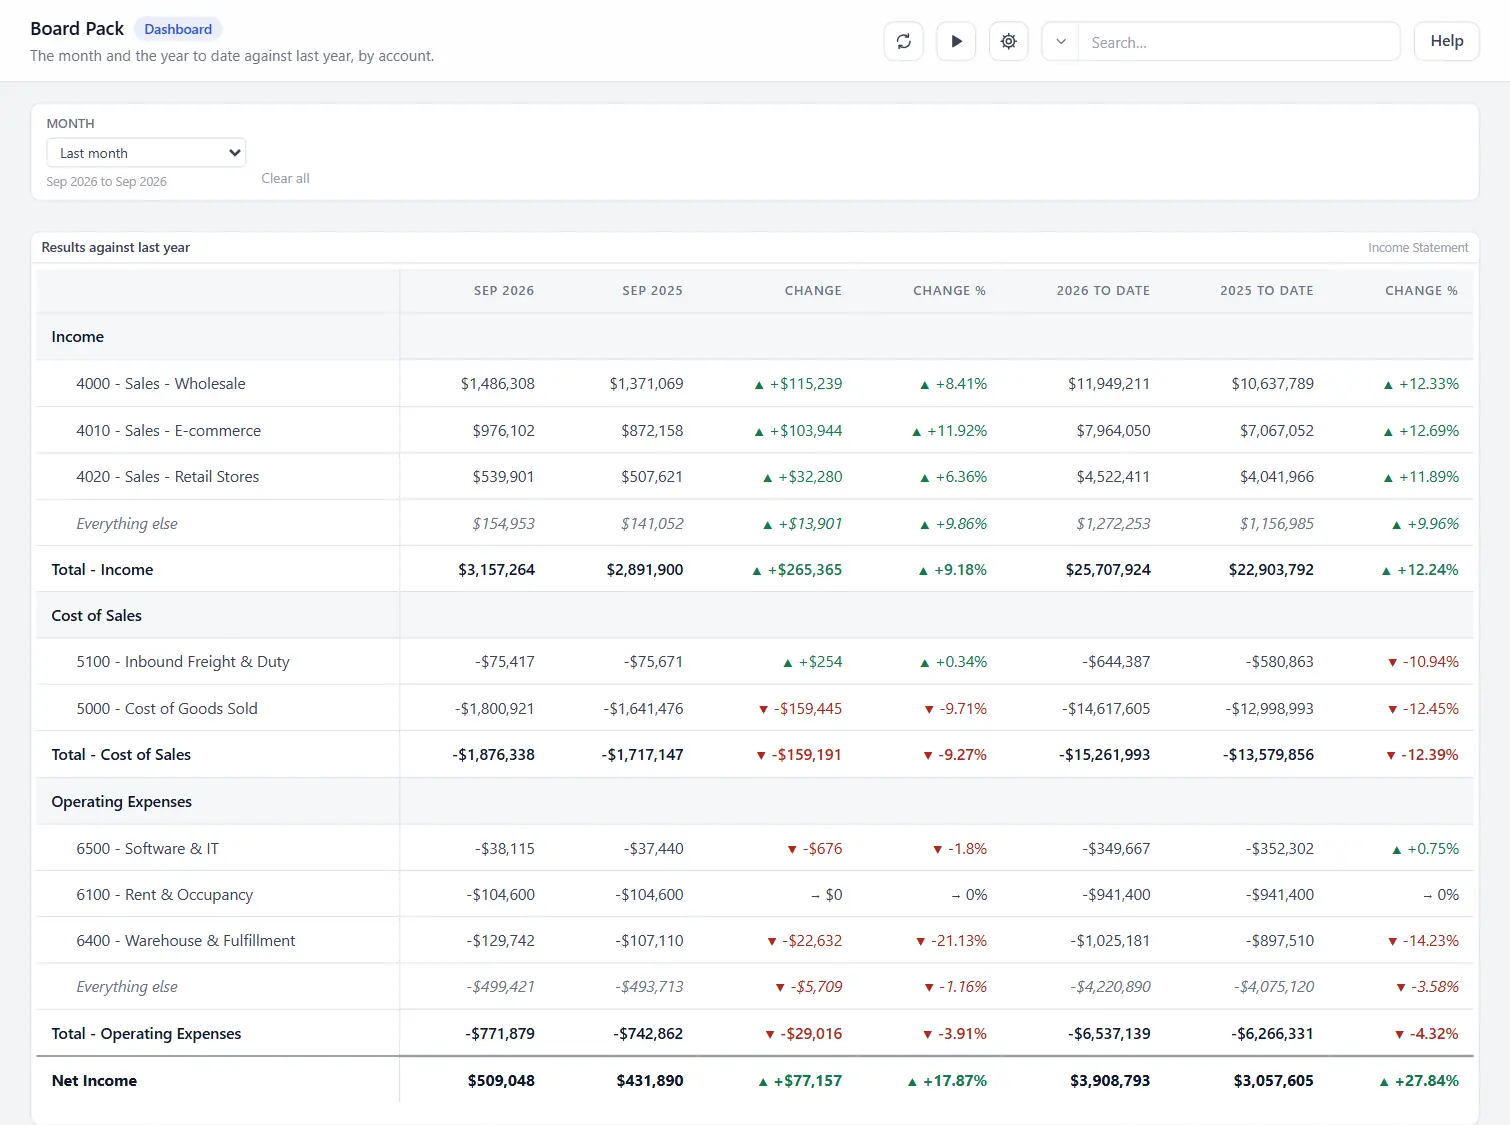
Comparison table or Statement
Both lay a report out as a table of figures. Choose by what the columns are.
| Use | When |
|---|---|
| Comparison table | You choose the columns yourself, each with its own period, and want the change between two of them. A board page that reads "this month, last year, change". |
| Statement | You want one column for every period the report holds, in order, with a Total column. An income statement by month. |
What the report needs
The widget does not run its own query. It arranges the rows of an ordinary report, so that report needs:
- a column for the lines, such as the department or the account;
- a date or month column, which says which period each row belongs to;
- one or more value columns, such as the amount, and a budget if you want to compare with one;
- optionally a column for sections, such as Income and Expenses.
The report must hold every period you want to show. To compare with last year, its rows must go back to last year.
Setting it up
- In the gear menu, choose Edit Layout on a report, or Edit dashboard, then choose Add widget and pick Comparison table. On a dashboard, choose the report first.
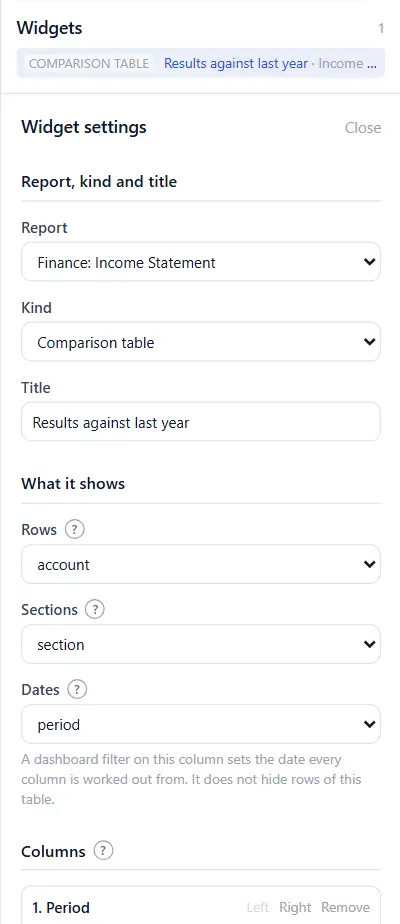
- Under What it shows in the side panel, set:
- Rows: the column whose values become the lines.
- Sections: a column that splits the lines into blocks, or None.
- Dates: the date or month column.
- Under Columns, build the list of columns, left to right. A new table starts with four: this month, the same month a year earlier, and the change as an amount and as a percentage.
- Under Lines, choose the order, how many lines to keep and which total lines to add.
- Under Good and bad changes, say which direction is good.
- Save the layout or the dashboard.
The columns
+ Period, + Change and + Share each add a column. Left and Right move a column, and Remove deletes it. A table holds up to 24 columns.
A period column
A period column adds up one figure over one period.
| Setting | What it does |
|---|---|
| Aggregate and On column | How the rows become one figure, and from which column. A balance column takes closing value when you pick it. |
| Period | This month, This quarter, This half year, This year, Year to date, the same for Last, the last 7, 30 or 90 days, or All dates. An account whose fiscal year does not start in January also lists the fiscal periods. |
| Moved back by | Moves the period earlier, by 1, 2, 3, 6 or 12 periods or by 1 or 2 years. This month moved back by The same period a year earlier is the same month of last year. Year to date moved back a year stops at the same day of last year. |
A balance, such as cash or receivables, must not be added up across months. With closing value, a column shows the figure at the end of its period, and a total line adds up each line's own closing figure.
A change column
A change column compares two period columns. Set Change of and Against: the change is the first less the second.
| Shown as | What you read |
|---|---|
| An amount | The difference, with its sign: +$1,200.00 |
| A percentage | The difference divided by the second column: +8.2% |
| Percentage points | For two percentages, such as two margins: +1.5 pts |
- A change reads n/a when it cannot be worked out, for example a percentage when the second column is zero.
- A line with no rows in one of the two periods is compared with zero when the figure is a sum or a count.
- Subtotals and totals work their change out from their own two figures. They never add up the changes of the lines above them.
A share column
A share column shows a period column's figure as a percentage of that column's total over every line.
Headings and formatting
The table writes each heading from its period, such as Sep 2026, Q3 2026, 2026 to date or FY2027 to date. A column over a second figure, such as a budget, also names that figure. Type a Heading to replace the one the table writes.
Each column follows the format of its report column and your account's Formatting settings. To change one column, set its Decimals, Negatives (in parentheses or with a minus sign) and Large figures (compact, such as 1.2M, or in full).
The lines
| Setting | What it does |
|---|---|
| Order | As the report lists them, By name, or by the figure of any column, High to low or Low to high. With sections, each section is ordered on its own. |
| Keep the top | Keeps that many lines in each section and adds the others up on one line, named Everything else unless you type a name. |
| A total line after each section | Shown when you set Sections |
| A last line over every row | The total, with a label of your choice such as Net Income |
| Total lines that leave rows out | A total over every row except the rows or sections you name. For example Core, leaving out Distribution. |
Good and bad changes
A change shows an arrow for its direction: up, down, or no change. Its colour says whether that direction is good: green for good, red for bad.
- Set A higher figure is to Good, as for sales or Bad, as for costs.
- In a table that mixes both, name the rows or sections that go the other way, such as Expenses.
- A change column can make its own choice under A higher figure is.
Costs stored as negative numbers need no setting. A cost that grows is a figure that falls.
Filters and the date the table reads
Every column is worked out from one date. Without a filter, that date is today.
On a dashboard, route a Month or Date filter to the widget's Dates column. The table then reads as of the last day of the filter's range. Choose September 2026, and This month is September 2026, the column moved back a year is September 2025, and Year to date runs from January to September. One filter moves every column.
- That filter does not hide rows of this table. If it did, every column but one would be empty.
- A filter with no end, such as After, leaves the table on today.
- Every other filter, such as a subsidiary or a department, narrows the rows as it does for any widget.
- On a report page, a filter set on the table below the widget works the same way.
- The widget's own Filter section keeps only the rows that match, before anything is added up.
Clicking a figure
A click on a figure opens the report on the rows behind it: the line you clicked, and the dates of its column. A section total opens its section, and the last line opens every row of the period. A change column and a line that adds up several names do not open anything. When clicked in the side panel can open another report or switch the click off. See Clicking a dashboard widget.
Emails, PDFs, Excel and print
- In an email and in a PDF, the table keeps its sections, total lines, arrows and colours. A table too wide for the page is split into blocks of columns, each one repeating the first column.
- In an Excel attachment, the table has its own sheet. The cells hold the numbers themselves, so a change in percent is a percentage Excel can add up or chart.
- On paper, a table wider than the sheet prints in bands of columns, each one repeating the first column.
- A scheduled email with no value in the Month filter reads as of the day it is sent, in your account's time zone.
If something looks wrong
| What you see | Why, and what to do |
|---|---|
| "Configure this table" | Pick the Rows column and the Dates column. |
| "Pick the value of at least one column of this table" | Choose On column in a period column. |
| "No rows in the periods of this table" | The report has no rows in any column's period. Check the date the table reads, and how far back the report's rows go. |
| A column for last year is empty | The report's own query or its starting filters stop before last year. |
| A column is missing | Its On column no longer exists in the report, or a change column points at a column that was removed. |
| Every heading starts with the same month, whatever the filter says | The filter is not routed to the widget's Dates column. |
| A change in percent reads n/a | The second column is zero or has no rows. |
| A balance is far too large | Its Aggregate is sum. Choose closing value. |
| The widget is missing after an import into another account | That account runs a version from before 1.16.10, which leaves out a widget it does not know. Update the account and the widget appears. If someone saved the layout there before the update, import the file again. |
Related: Building a dashboard · The Statement widget · Dashboard filters · Fiscal periods, year to date and balances · Formatting numbers, currencies, percentages and dates · Scheduled emails