
Ranked tables and a chart's total
Add a rank, a share of the total and a running share to a grouped table, lines under it for the top, the others and the total, a total under a chart, and the Plain look for a short table.
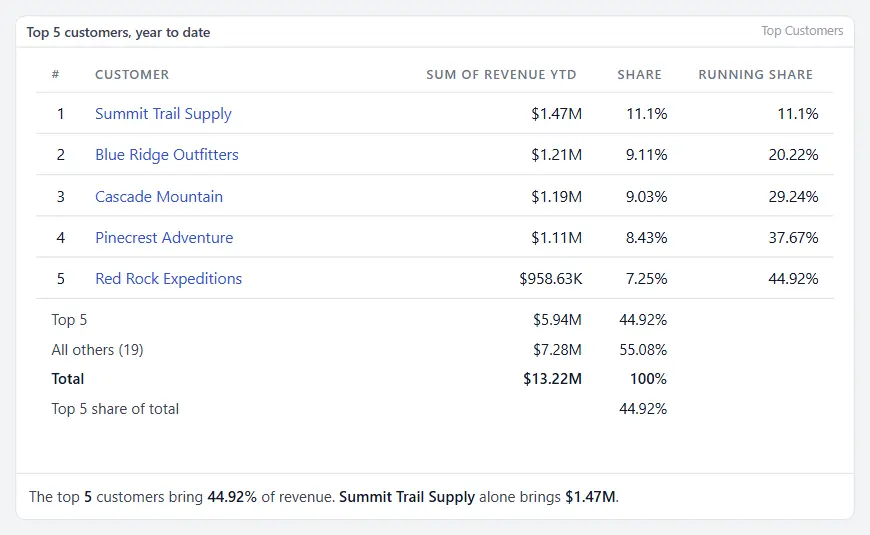
A ranked table is a grouped table with more on each line and under it: the rank of each line, its share of the total, the share of the lines down to it, and lines that say what the lines shown add up to, what the others add up to and what everything adds up to. A chart can write the same total under its plot. Use it for the top customers, vendors or items.
Set up a ranked table
- In the gear menu, choose Edit Layout on a report, or Edit dashboard, and add or select a Table widget.
- Under What it shows, set Group by to the column to rank, such as the customer. Set Aggregate to sum and On column to the figure.
- Set Sort to High to low and Limit to the number of lines to keep, such as 10.
- Open Rank and share and tick what you want.
- Save the layout or the dashboard.
A grouped table shows the group and its figure, in the format of the column the figure comes from. Before 1.16.15 it showed the group alone.
The look of a table: Full or Plain
Every table widget has a Look, under Rows and totals.
| Look | What the table shows | Use it for |
|---|---|---|
| Full | Rows per page, the paging buttons, a filter box on each column and Export | A long table the reader works in |
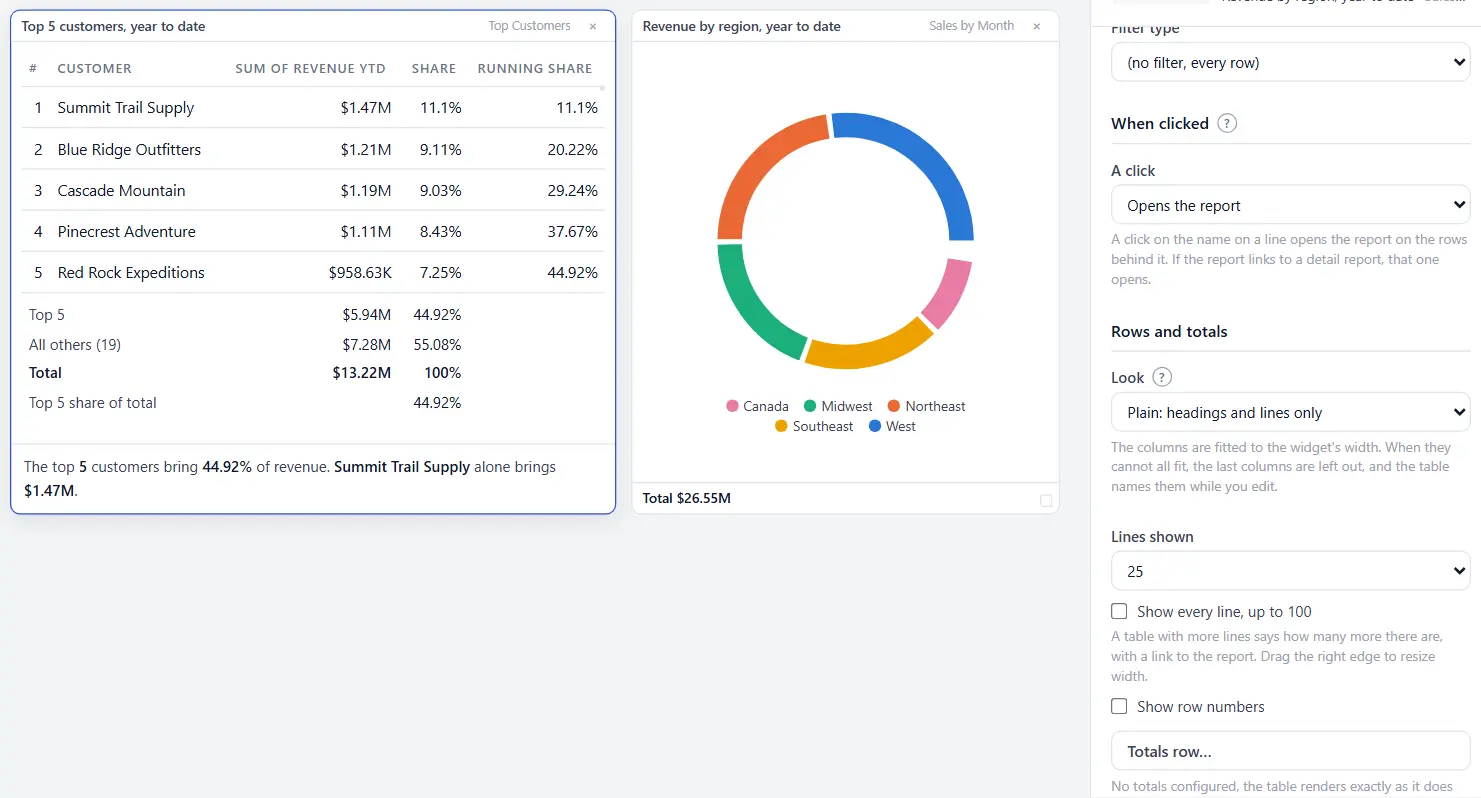
| Plain | The headings and the lines, and nothing else | A short table on a dashboard, such as a top five |
Which look a table starts on:
- A table with a rank or share column, or a line under it, is Plain.
- A table you give a Limit switches to Plain at that moment, unless you already chose a look.
- Every other table is Full, as before. That includes a grouped table without a Limit, which can have hundreds of lines.
- A table saved before 1.17.0 keeps the look it had. The one exception is a table with rank and share options, which exist since 1.16.15: it is drawn Plain until its author chooses Full.
What a plain table does:
- It fits its columns to the widget. There is no sideways scrollbar and no column cut in half. In a narrow widget the space between columns tightens, a long heading goes onto two lines, and a long name ends in an ellipsis. Point at the name to read it whole. A figure or a date is never cut.
- It leaves out the last columns when they still cannot fit, the last one first. The name and the first figure after it always stay.
- In a very narrow widget it gives up more before it scrolls. Next go the columns before the name, such as the rank, since the order of the lines already says it. Then any column between the name and its figure. Then the name goes onto two lines. Only when the name on two lines and its figure still do not fit does the table scroll sideways. That is below about 150 pixels for a name and an amount such as $24,000.00.
- It tells every reader what it left out, in one line under the table: 2 more columns in the report, or 12 more lines and 2 more columns in the report. The line is a link to the report, where every column is. While you edit, the widget also names the columns. Widen the widget, or untick columns under Columns shown, to choose for yourself.
- It draws the first lines and counts the rest. Lines shown sets how many, 100 at most. A table with more says so in the same line, such as 18 more lines. The link opens the report with the dashboard's filters and the widget's own, under the widget's When clicked setting. On the report's own page, and with When clicked set to do nothing, the line is text.
- A click on a heading sorts, and a second click reverses the order.
- The totals row and the lines under the table stay.
The columns
| Choice | What it adds |
|---|---|
| A rank column | A number for each line: 1 for the largest figure. With Sort on Low to high, 1 is the smallest. |
| A share of total column | The line's figure as a percentage of the total of every group, the ones the Limit hides included. |
| A running share column | The shares added up from the first line down to this one. |
- Lines with the same figure share a rank, and the next rank is skipped: 1, 2, 2, 4.
- The rank is worked out over every group, so a line keeps its rank whatever the Limit.
- With Sort on Keep group order, the lines stay in the order of the report and each still shows its rank by figure.
- A reader can sort the table by any column. The rank stays with its line.
The lines under the table
| Choice | What it writes |
|---|---|
| The lines shown, added up | Top 10 and their total. It reads Bottom 10 when the table is sorted low to high, and First 10 when it keeps the order of the groups. |
| All others | All others (235): the total of the groups the Limit hides, and how many they are. Left out when it hides none. |
| The total of everything | Total and the total of every group. |
| The lines shown as a share of everything | Top 10 share of total and the percentage. |
Tick a line and a box appears under it for its name. Type one to replace the name the table writes. The count of All others follows your name too.
The lines are rows of the table itself, on both looks:
- The name of a line is under the names, across the rank and the name columns.
- Its figure is under the column it adds up, right-aligned with the figures above it.
- With a share of total column, each line writes its share under it: the share of the lines shown, the share of the others, and 100% for the total. Nothing is written under the running share.
- The lines shown as a share of everything writes its percentage under the share column, or under the figure when the table has no share column.
- A rule separates the lines from the table, and the total is in bold.
- When a narrow widget leaves a column out, its figures on these lines go with it. The figure's own column never goes.
The lines follow the widget's format and the Numbers choice.
When a Limit hides groups and there is no All others line
A table still says how many groups its Limit hides. Without an All others line (it is not ticked, or the figures do not add up), a quiet line under the table counts them, such as 235 more lines. It is a link to the report with the widget's filters, not narrowed to the lines shown. It follows the widget's When clicked setting, as the names of the lines do.
Figures that do not add up
A share and All others need figures that add up: a sum or a count. With an average, a median, a minimum, a maximum, a distinct count or a closing value:
- the table shows the rank and the figure, and no share column;
- The total of everything writes that aggregate over every row, such as the average over all rows;
- the other lines are left out.
The panel says so under the choices.
A total under a chart
Bar, horizontal bar, pie and donut charts have Show the total under the chart, under How it looks.
- A chart that draws everything writes Total and the figure.
- A chart with a Limit writes how many it draws of how many, their total and their share, such as Top 15 of 240: $1.2M, 62% of the total.
- An average is written as Over everything and the average over all rows.
Clicks
- A click on a line's name opens the report on that group, as on any grouped table.
- The lines under the table and the total under a chart open nothing. Each adds up several groups, so there is no one group to open. The comparison table treats its Everything else line the same way.
Several figures on a line
A ranked table has one figure for each line. For several figures on a line, such as this year, last year and the change, use the Comparison table. It has its own Keep the top setting, an Everything else line, a share column and a total line.
In emails, PDFs and print
- A scheduled email and a PDF write the table with its rank and share columns and the lines under it, and a chart's total under the chart.
- An Excel attachment holds the rank and the shares as numbers, then All others, with its count, and Total as two rows under the lines.
- Print this page prints the table and its lines in its card, each figure of the lines under its column. A plain table is fitted to its card on the sheet as it is on screen, and prints how many columns it left out. Print landscape, or widen the widget, for more columns.
- A scheduled email and a PDF draw the lines under the table as rows of the table too, each figure under its column. They draw every column a table has, across the width of the email or the sheet, so they have no line about columns left out.
- A scheduled email, a PDF and an Excel attachment already write a table without controls. The look changes nothing in them, and they hold every line the table has, up to their own limits.
If something looks wrong
| What you see | What to check |
|---|---|
| No Rank and share section | The table is not grouped. Set Group by and Aggregate under What it shows. |
| No share column though it is ticked | The aggregate is not a sum or a count. See Figures that do not add up. |
| No All others line | The Limit hides no group, or no Limit is set. |
| The shares do not add up to 100% | The table shows the top lines only. The lines shown and All others add up to 100%. Each share is rounded for display. |
| A column is missing from a plain table | The widget is too narrow for it at this window size. The line under the table says how many, and opens the report. In the editor the widget names them. Widen it, or remove a column you need less under Columns shown. |
| The rank is missing from a narrow ranked table | The widget is too narrow for the rank, the name and the figure. The lines are still in the order of the rank. |
| No filter boxes, paging or Export on a table | Its Look is Plain. Set it to Full under Rows and totals. A reader who needs every line clicks more lines, or opens the report. |
| A ranked table changed after the update to 1.17.0 | Ranked tables are drawn Plain unless a look was chosen. Set Look to Full to bring the grid back. |
| An account on an older version | A version before 1.17.0 draws every table Full and ignores the look. A version before 1.16.15 shows the names of the groups alone, with no rank, no share and no line under the table, and a chart without its total. |
Related: Building a dashboard · The Comparison table widget · Commentary on a widget · Clicking a dashboard widget · Charts on a report · Scheduled emails